Serbian vs U.S. Virgin Islander Male Poverty
COMPARE
Serbian
U.S. Virgin Islander
Male Poverty
Male Poverty Comparison
Serbians
U.S. Virgin Islanders
10.2%
MALE POVERTY
97.5/ 100
METRIC RATING
66th/ 347
METRIC RANK
14.7%
MALE POVERTY
0.0/ 100
METRIC RATING
319th/ 347
METRIC RANK
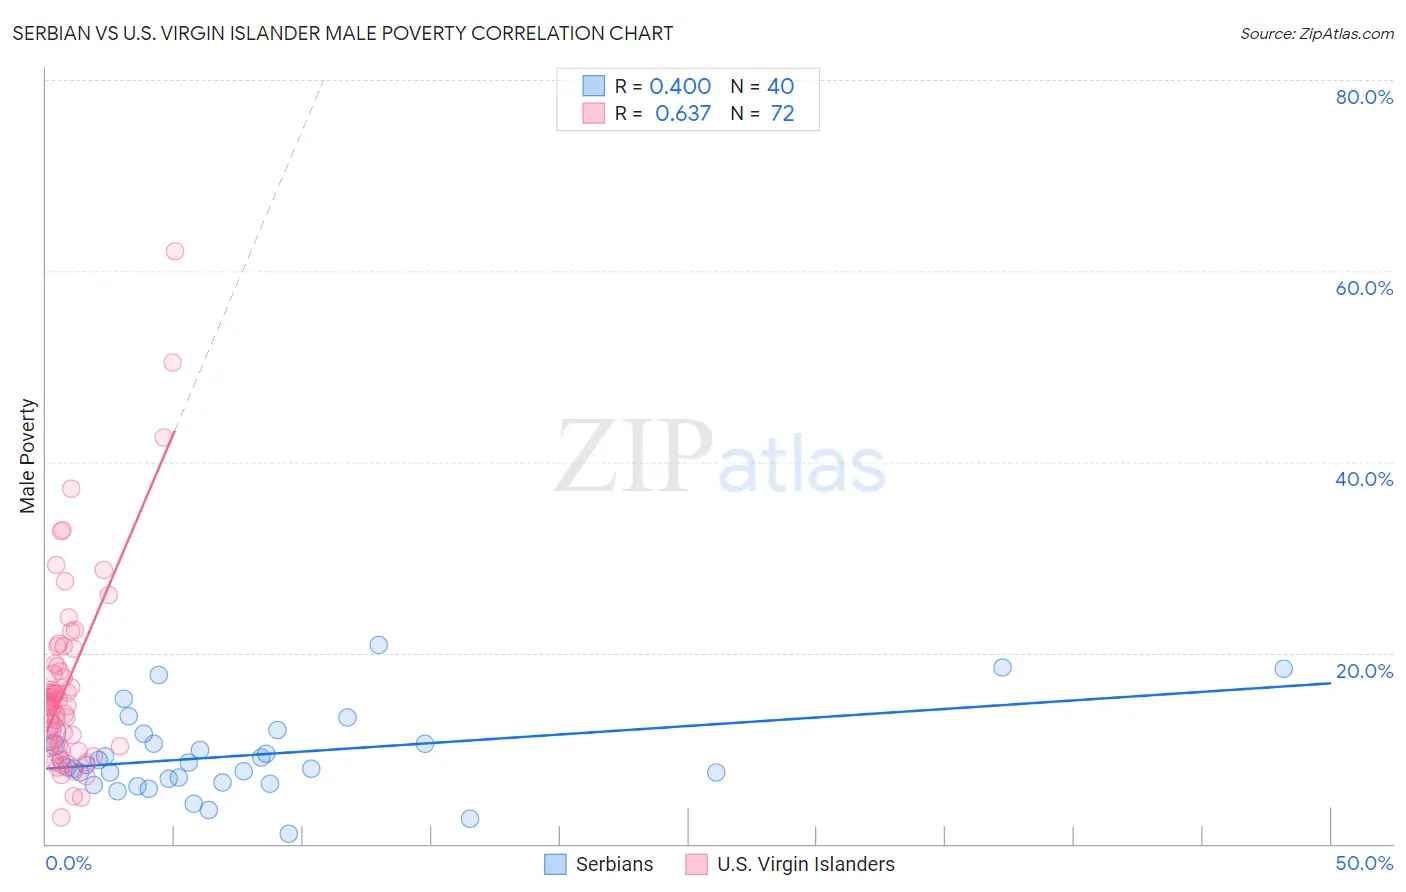
Serbian vs U.S. Virgin Islander Male Poverty Correlation Chart
The statistical analysis conducted on geographies consisting of 267,465,606 people shows a mild positive correlation between the proportion of Serbians and poverty level among males in the United States with a correlation coefficient (R) of 0.400 and weighted average of 10.2%. Similarly, the statistical analysis conducted on geographies consisting of 87,513,000 people shows a significant positive correlation between the proportion of U.S. Virgin Islanders and poverty level among males in the United States with a correlation coefficient (R) of 0.637 and weighted average of 14.7%, a difference of 44.4%.
Male Poverty Correlation Summary
| Measurement | Serbian | U.S. Virgin Islander |
| Minimum | 1.0% | 2.7% |
| Maximum | 20.8% | 62.0% |
| Range | 19.8% | 59.3% |
| Mean | 9.3% | 16.8% |
| Median | 8.4% | 14.9% |
| Interquartile 25% (IQ1) | 6.6% | 10.4% |
| Interquartile 75% (IQ3) | 11.0% | 18.7% |
| Interquartile Range (IQR) | 4.4% | 8.3% |
| Standard Deviation (Sample) | 4.3% | 10.1% |
| Standard Deviation (Population) | 4.3% | 10.0% |
Similar Demographics by Male Poverty
Demographics Similar to Serbians by Male Poverty
In terms of male poverty, the demographic groups most similar to Serbians are Zimbabwean (10.2%, a difference of 0.010%), Swiss (10.2%, a difference of 0.080%), Immigrants from Netherlands (10.2%, a difference of 0.17%), Immigrants from Sri Lanka (10.2%, a difference of 0.22%), and Slovak (10.2%, a difference of 0.31%).
| Demographics | Rating | Rank | Male Poverty |
| Immigrants | Europe | 97.9 /100 | #59 | Exceptional 10.1% |
| Ukrainians | 97.9 /100 | #60 | Exceptional 10.1% |
| Austrians | 97.8 /100 | #61 | Exceptional 10.1% |
| Immigrants | Italy | 97.8 /100 | #62 | Exceptional 10.2% |
| Slovaks | 97.7 /100 | #63 | Exceptional 10.2% |
| Swiss | 97.5 /100 | #64 | Exceptional 10.2% |
| Zimbabweans | 97.5 /100 | #65 | Exceptional 10.2% |
| Serbians | 97.5 /100 | #66 | Exceptional 10.2% |
| Immigrants | Netherlands | 97.3 /100 | #67 | Exceptional 10.2% |
| Immigrants | Sri Lanka | 97.2 /100 | #68 | Exceptional 10.2% |
| Immigrants | Australia | 97.1 /100 | #69 | Exceptional 10.2% |
| Paraguayans | 97.1 /100 | #70 | Exceptional 10.2% |
| Europeans | 97.1 /100 | #71 | Exceptional 10.2% |
| Immigrants | Canada | 97.1 /100 | #72 | Exceptional 10.2% |
| Immigrants | Asia | 97.0 /100 | #73 | Exceptional 10.2% |
Demographics Similar to U.S. Virgin Islanders by Male Poverty
In terms of male poverty, the demographic groups most similar to U.S. Virgin Islanders are Immigrants from Grenada (14.7%, a difference of 0.030%), Immigrants from Dominica (14.7%, a difference of 0.090%), Immigrants from Congo (14.7%, a difference of 0.090%), British West Indian (14.6%, a difference of 0.76%), and Chippewa (14.6%, a difference of 0.79%).
| Demographics | Rating | Rank | Male Poverty |
| Choctaw | 0.0 /100 | #312 | Tragic 14.4% |
| Immigrants | Somalia | 0.0 /100 | #313 | Tragic 14.6% |
| Immigrants | Honduras | 0.0 /100 | #314 | Tragic 14.6% |
| Chippewa | 0.0 /100 | #315 | Tragic 14.6% |
| British West Indians | 0.0 /100 | #316 | Tragic 14.6% |
| Immigrants | Dominica | 0.0 /100 | #317 | Tragic 14.7% |
| Immigrants | Grenada | 0.0 /100 | #318 | Tragic 14.7% |
| U.S. Virgin Islanders | 0.0 /100 | #319 | Tragic 14.7% |
| Immigrants | Congo | 0.0 /100 | #320 | Tragic 14.7% |
| Arapaho | 0.0 /100 | #321 | Tragic 15.1% |
| Kiowa | 0.0 /100 | #322 | Tragic 15.2% |
| Colville | 0.0 /100 | #323 | Tragic 15.2% |
| Menominee | 0.0 /100 | #324 | Tragic 15.3% |
| Yakama | 0.0 /100 | #325 | Tragic 15.3% |
| Central American Indians | 0.0 /100 | #326 | Tragic 15.3% |