Turkish vs American Female Poverty Among 25-34 Year Olds
COMPARE
Turkish
American
Female Poverty Among 25-34 Year Olds
Female Poverty Among 25-34 Year Olds Comparison
Turks
Americans
11.4%
FEMALE POVERTY AMONG 25-34 YEAR OLDS
100.0/ 100
METRIC RATING
21st/ 347
METRIC RANK
16.4%
FEMALE POVERTY AMONG 25-34 YEAR OLDS
0.0/ 100
METRIC RATING
287th/ 347
METRIC RANK
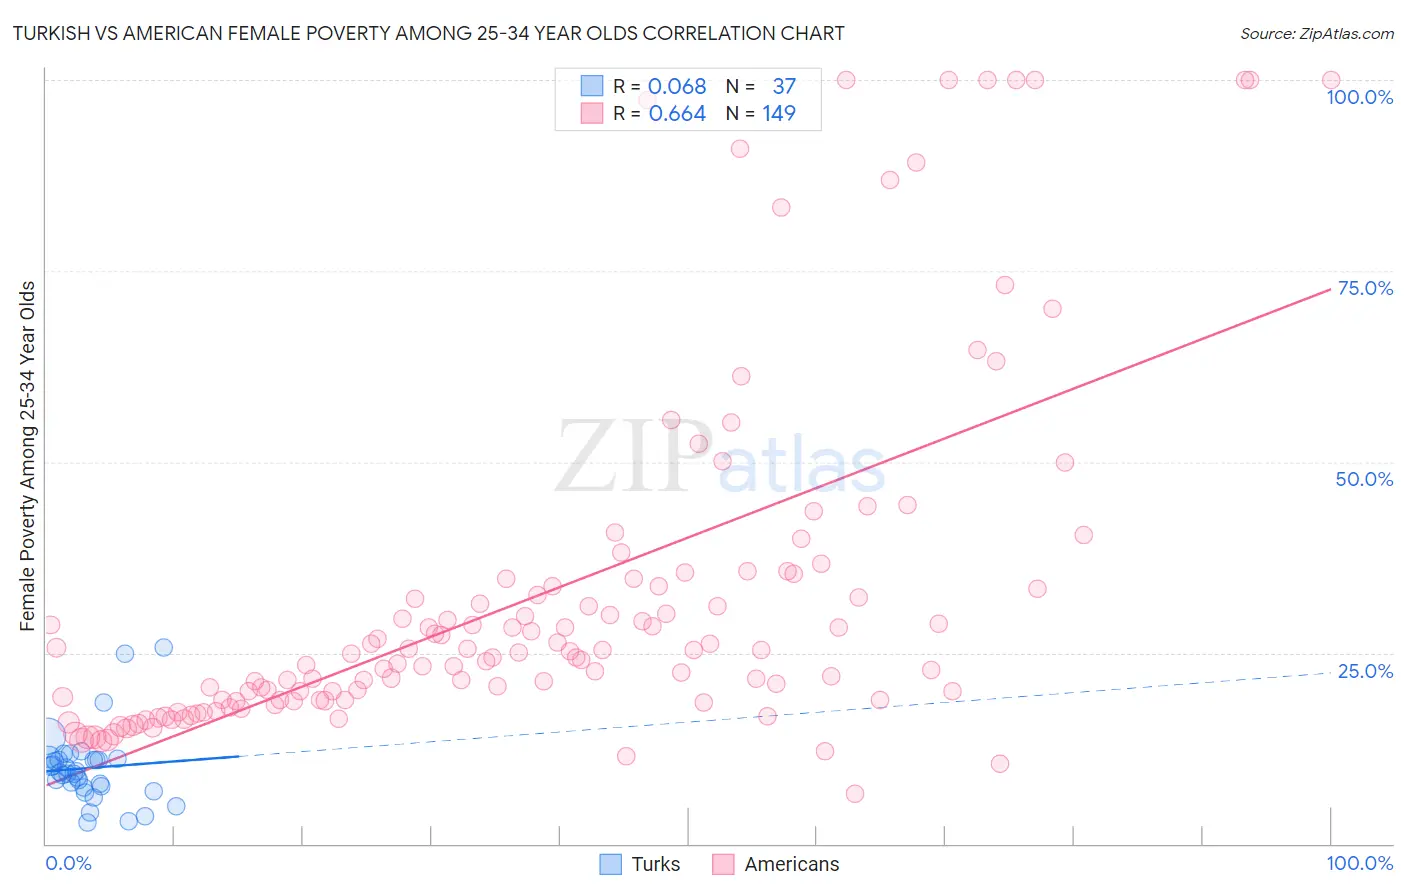
Turkish vs American Female Poverty Among 25-34 Year Olds Correlation Chart
The statistical analysis conducted on geographies consisting of 268,457,776 people shows a slight positive correlation between the proportion of Turks and poverty level among females between the ages 25 and 34 in the United States with a correlation coefficient (R) of 0.068 and weighted average of 11.4%. Similarly, the statistical analysis conducted on geographies consisting of 557,545,883 people shows a significant positive correlation between the proportion of Americans and poverty level among females between the ages 25 and 34 in the United States with a correlation coefficient (R) of 0.664 and weighted average of 16.4%, a difference of 43.5%.
Female Poverty Among 25-34 Year Olds Correlation Summary
| Measurement | Turkish | American |
| Minimum | 2.8% | 6.5% |
| Maximum | 25.6% | 100.0% |
| Range | 22.8% | 93.5% |
| Mean | 9.9% | 32.5% |
| Median | 9.3% | 25.0% |
| Interquartile 25% (IQ1) | 7.5% | 18.8% |
| Interquartile 75% (IQ3) | 11.1% | 34.2% |
| Interquartile Range (IQR) | 3.6% | 15.5% |
| Standard Deviation (Sample) | 4.8% | 22.9% |
| Standard Deviation (Population) | 4.8% | 22.8% |
Similar Demographics by Female Poverty Among 25-34 Year Olds
Demographics Similar to Turks by Female Poverty Among 25-34 Year Olds
In terms of female poverty among 25-34 year olds, the demographic groups most similar to Turks are Asian (11.4%, a difference of 0.15%), Bolivian (11.4%, a difference of 0.21%), Maltese (11.4%, a difference of 0.24%), Bhutanese (11.4%, a difference of 0.46%), and Tongan (11.5%, a difference of 0.61%).
| Demographics | Rating | Rank | Female Poverty Among 25-34 Year Olds |
| Indians (Asian) | 100.0 /100 | #14 | Exceptional 11.2% |
| Assyrians/Chaldeans/Syriacs | 100.0 /100 | #15 | Exceptional 11.2% |
| Immigrants | Bolivia | 100.0 /100 | #16 | Exceptional 11.2% |
| Immigrants | China | 100.0 /100 | #17 | Exceptional 11.2% |
| Immigrants | Eastern Asia | 100.0 /100 | #18 | Exceptional 11.2% |
| Iranians | 100.0 /100 | #19 | Exceptional 11.2% |
| Okinawans | 100.0 /100 | #20 | Exceptional 11.3% |
| Turks | 100.0 /100 | #21 | Exceptional 11.4% |
| Asians | 99.9 /100 | #22 | Exceptional 11.4% |
| Bolivians | 99.9 /100 | #23 | Exceptional 11.4% |
| Maltese | 99.9 /100 | #24 | Exceptional 11.4% |
| Bhutanese | 99.9 /100 | #25 | Exceptional 11.4% |
| Tongans | 99.9 /100 | #26 | Exceptional 11.5% |
| Immigrants | Greece | 99.9 /100 | #27 | Exceptional 11.5% |
| Immigrants | Pakistan | 99.9 /100 | #28 | Exceptional 11.5% |
Demographics Similar to Americans by Female Poverty Among 25-34 Year Olds
In terms of female poverty among 25-34 year olds, the demographic groups most similar to Americans are Cape Verdean (16.3%, a difference of 0.050%), Guatemalan (16.4%, a difference of 0.19%), Immigrants from Bahamas (16.3%, a difference of 0.23%), Osage (16.4%, a difference of 0.25%), and Indonesian (16.4%, a difference of 0.40%).
| Demographics | Rating | Rank | Female Poverty Among 25-34 Year Olds |
| Bangladeshis | 0.0 /100 | #280 | Tragic 15.9% |
| Immigrants | Latin America | 0.0 /100 | #281 | Tragic 16.0% |
| Aleuts | 0.0 /100 | #282 | Tragic 16.1% |
| Bahamians | 0.0 /100 | #283 | Tragic 16.1% |
| Shoshone | 0.0 /100 | #284 | Tragic 16.2% |
| Immigrants | Bahamas | 0.0 /100 | #285 | Tragic 16.3% |
| Cape Verdeans | 0.0 /100 | #286 | Tragic 16.3% |
| Americans | 0.0 /100 | #287 | Tragic 16.4% |
| Guatemalans | 0.0 /100 | #288 | Tragic 16.4% |
| Osage | 0.0 /100 | #289 | Tragic 16.4% |
| Indonesians | 0.0 /100 | #290 | Tragic 16.4% |
| Comanche | 0.0 /100 | #291 | Tragic 16.5% |
| Immigrants | Dominica | 0.0 /100 | #292 | Tragic 16.5% |
| Potawatomi | 0.0 /100 | #293 | Tragic 16.5% |
| Immigrants | Central America | 0.0 /100 | #294 | Tragic 16.6% |