Senegalese vs American Female Poverty Among 25-34 Year Olds
COMPARE
Senegalese
American
Female Poverty Among 25-34 Year Olds
Female Poverty Among 25-34 Year Olds Comparison
Senegalese
Americans
15.6%
FEMALE POVERTY AMONG 25-34 YEAR OLDS
0.1/ 100
METRIC RATING
272nd/ 347
METRIC RANK
16.4%
FEMALE POVERTY AMONG 25-34 YEAR OLDS
0.0/ 100
METRIC RATING
287th/ 347
METRIC RANK
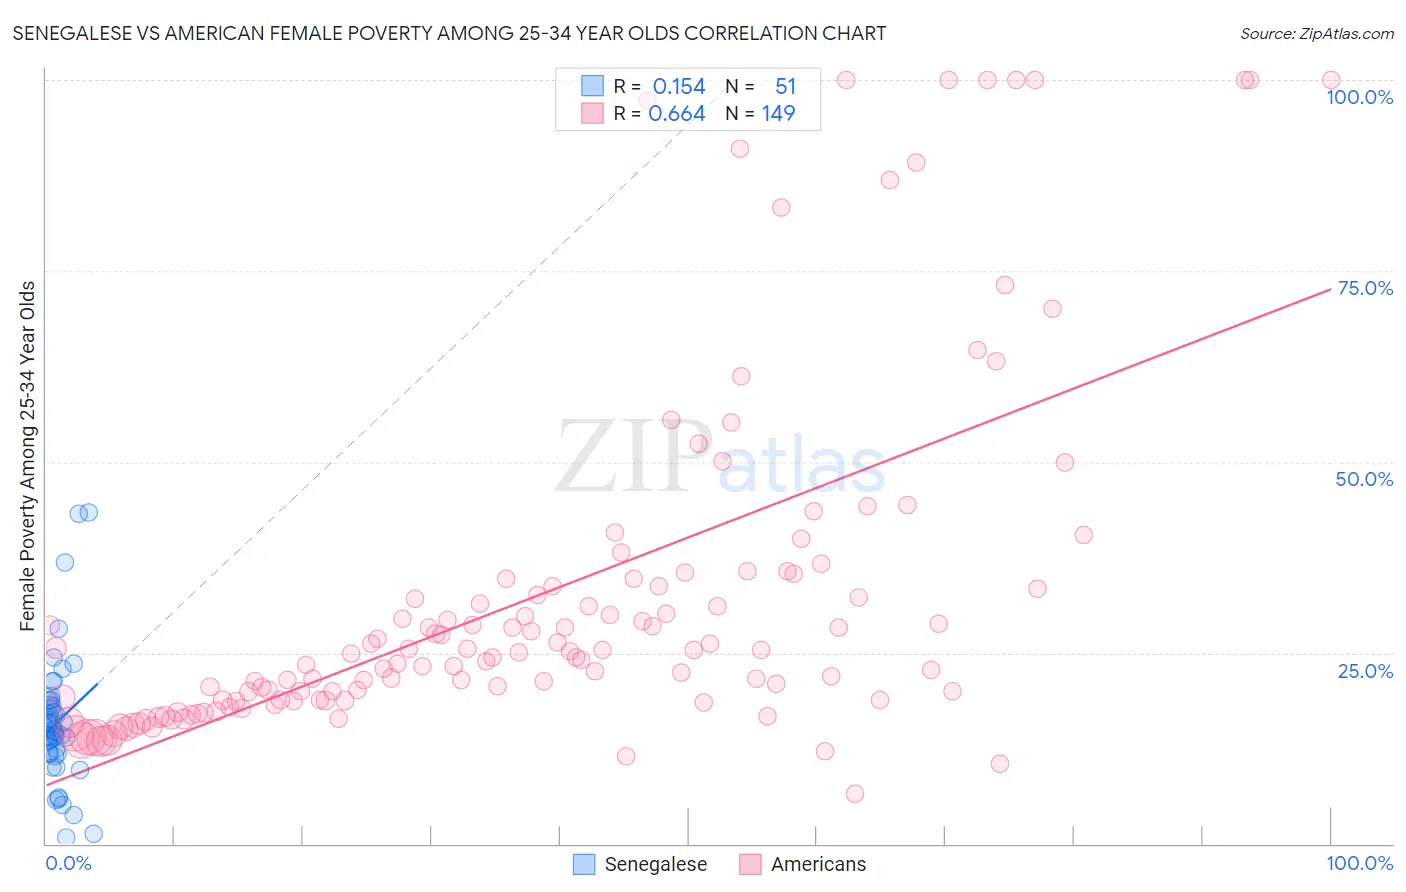
Senegalese vs American Female Poverty Among 25-34 Year Olds Correlation Chart
The statistical analysis conducted on geographies consisting of 77,949,364 people shows a poor positive correlation between the proportion of Senegalese and poverty level among females between the ages 25 and 34 in the United States with a correlation coefficient (R) of 0.154 and weighted average of 15.6%. Similarly, the statistical analysis conducted on geographies consisting of 557,545,883 people shows a significant positive correlation between the proportion of Americans and poverty level among females between the ages 25 and 34 in the United States with a correlation coefficient (R) of 0.664 and weighted average of 16.4%, a difference of 4.7%.
Female Poverty Among 25-34 Year Olds Correlation Summary
| Measurement | Senegalese | American |
| Minimum | 0.82% | 6.5% |
| Maximum | 43.4% | 100.0% |
| Range | 42.6% | 93.5% |
| Mean | 15.9% | 32.5% |
| Median | 14.8% | 25.0% |
| Interquartile 25% (IQ1) | 11.8% | 18.8% |
| Interquartile 75% (IQ3) | 18.7% | 34.2% |
| Interquartile Range (IQR) | 6.9% | 15.5% |
| Standard Deviation (Sample) | 8.5% | 22.9% |
| Standard Deviation (Population) | 8.4% | 22.8% |
Demographics Similar to Senegalese and Americans by Female Poverty Among 25-34 Year Olds
In terms of female poverty among 25-34 year olds, the demographic groups most similar to Senegalese are Cree (15.6%, a difference of 0.060%), British West Indian (15.6%, a difference of 0.070%), Nonimmigrants (15.6%, a difference of 0.11%), Subsaharan African (15.6%, a difference of 0.22%), and Immigrants from Caribbean (15.7%, a difference of 0.60%). Similarly, the demographic groups most similar to Americans are Cape Verdean (16.3%, a difference of 0.050%), Guatemalan (16.4%, a difference of 0.19%), Immigrants from Bahamas (16.3%, a difference of 0.23%), Osage (16.4%, a difference of 0.25%), and Shoshone (16.2%, a difference of 0.73%).
| Demographics | Rating | Rank | Female Poverty Among 25-34 Year Olds |
| Sub-Saharan Africans | 0.1 /100 | #269 | Tragic 15.6% |
| British West Indians | 0.1 /100 | #270 | Tragic 15.6% |
| Cree | 0.1 /100 | #271 | Tragic 15.6% |
| Senegalese | 0.1 /100 | #272 | Tragic 15.6% |
| Immigrants | Nonimmigrants | 0.1 /100 | #273 | Tragic 15.6% |
| Immigrants | Caribbean | 0.0 /100 | #274 | Tragic 15.7% |
| Immigrants | Azores | 0.0 /100 | #275 | Tragic 15.8% |
| Immigrants | Zaire | 0.0 /100 | #276 | Tragic 15.8% |
| Immigrants | Micronesia | 0.0 /100 | #277 | Tragic 15.8% |
| French American Indians | 0.0 /100 | #278 | Tragic 15.9% |
| Fijians | 0.0 /100 | #279 | Tragic 15.9% |
| Bangladeshis | 0.0 /100 | #280 | Tragic 15.9% |
| Immigrants | Latin America | 0.0 /100 | #281 | Tragic 16.0% |
| Aleuts | 0.0 /100 | #282 | Tragic 16.1% |
| Bahamians | 0.0 /100 | #283 | Tragic 16.1% |
| Shoshone | 0.0 /100 | #284 | Tragic 16.2% |
| Immigrants | Bahamas | 0.0 /100 | #285 | Tragic 16.3% |
| Cape Verdeans | 0.0 /100 | #286 | Tragic 16.3% |
| Americans | 0.0 /100 | #287 | Tragic 16.4% |
| Guatemalans | 0.0 /100 | #288 | Tragic 16.4% |
| Osage | 0.0 /100 | #289 | Tragic 16.4% |