Immigrants from Guyana vs Somali Male Poverty
COMPARE
Immigrants from Guyana
Somali
Male Poverty
Male Poverty Comparison
Immigrants from Guyana
Somalis
13.2%
MALE POVERTY
0.1/ 100
METRIC RATING
266th/ 347
METRIC RANK
14.3%
MALE POVERTY
0.0/ 100
METRIC RATING
309th/ 347
METRIC RANK
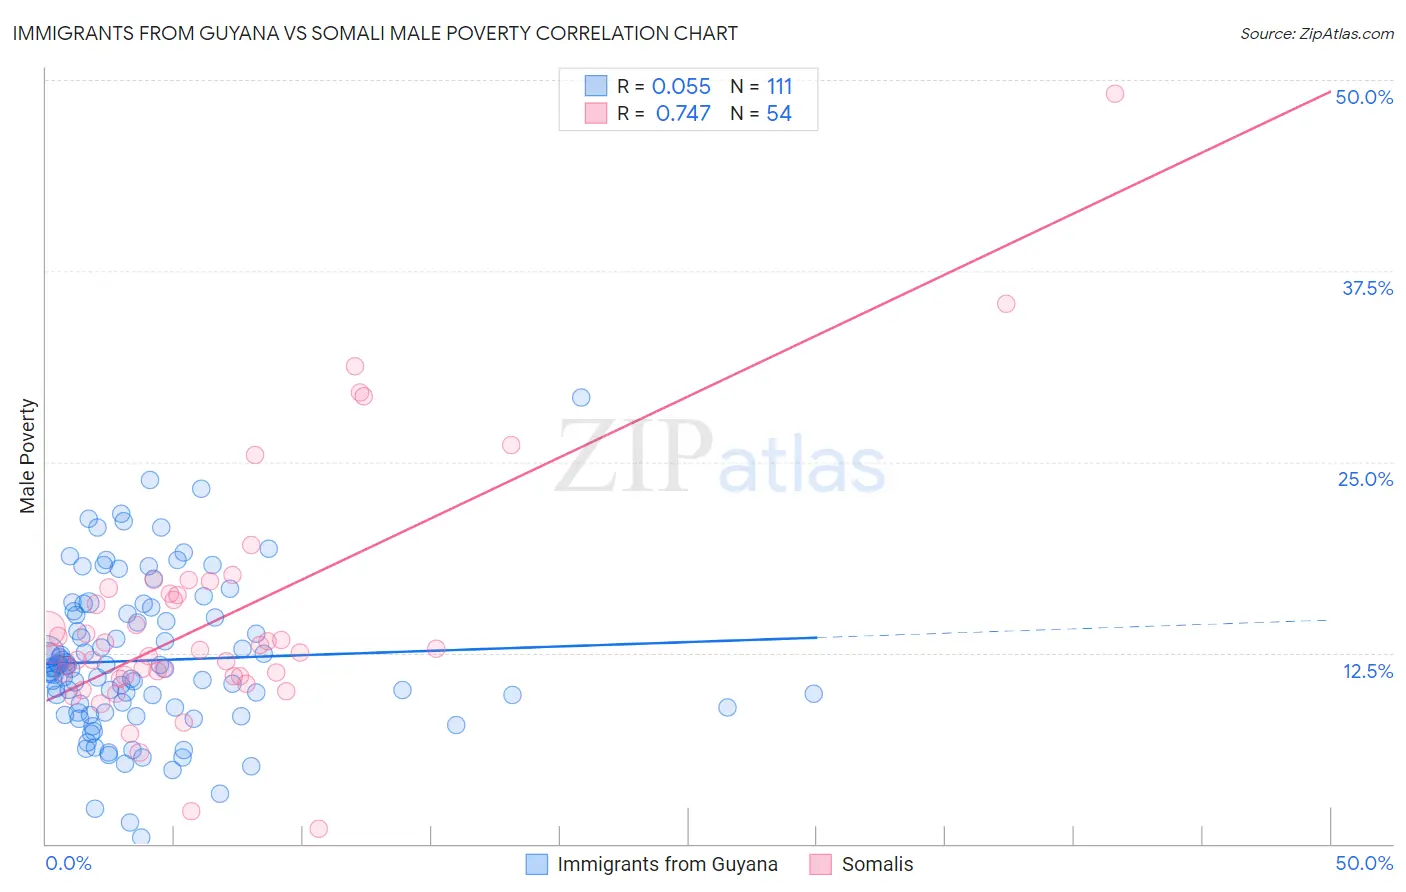
Immigrants from Guyana vs Somali Male Poverty Correlation Chart
The statistical analysis conducted on geographies consisting of 183,559,274 people shows a slight positive correlation between the proportion of Immigrants from Guyana and poverty level among males in the United States with a correlation coefficient (R) of 0.055 and weighted average of 13.2%. Similarly, the statistical analysis conducted on geographies consisting of 99,289,063 people shows a strong positive correlation between the proportion of Somalis and poverty level among males in the United States with a correlation coefficient (R) of 0.747 and weighted average of 14.3%, a difference of 7.8%.
Male Poverty Correlation Summary
| Measurement | Immigrants from Guyana | Somali |
| Minimum | 0.44% | 1.0% |
| Maximum | 29.2% | 49.1% |
| Range | 28.8% | 48.1% |
| Mean | 12.0% | 14.8% |
| Median | 11.4% | 12.6% |
| Interquartile 25% (IQ1) | 8.6% | 10.9% |
| Interquartile 75% (IQ3) | 15.1% | 16.4% |
| Interquartile Range (IQR) | 6.5% | 5.4% |
| Standard Deviation (Sample) | 5.0% | 8.1% |
| Standard Deviation (Population) | 5.0% | 8.0% |
Similar Demographics by Male Poverty
Demographics Similar to Immigrants from Guyana by Male Poverty
In terms of male poverty, the demographic groups most similar to Immigrants from Guyana are Immigrants from Jamaica (13.3%, a difference of 0.11%), Jamaican (13.2%, a difference of 0.14%), Subsaharan African (13.3%, a difference of 0.14%), Iroquois (13.2%, a difference of 0.16%), and Guyanese (13.3%, a difference of 0.36%).
| Demographics | Rating | Rank | Male Poverty |
| Cherokee | 0.1 /100 | #259 | Tragic 13.1% |
| Ottawa | 0.1 /100 | #260 | Tragic 13.1% |
| Trinidadians and Tobagonians | 0.1 /100 | #261 | Tragic 13.1% |
| Spanish American Indians | 0.1 /100 | #262 | Tragic 13.1% |
| Central Americans | 0.1 /100 | #263 | Tragic 13.2% |
| Iroquois | 0.1 /100 | #264 | Tragic 13.2% |
| Jamaicans | 0.1 /100 | #265 | Tragic 13.2% |
| Immigrants | Guyana | 0.1 /100 | #266 | Tragic 13.2% |
| Immigrants | Jamaica | 0.1 /100 | #267 | Tragic 13.3% |
| Sub-Saharan Africans | 0.1 /100 | #268 | Tragic 13.3% |
| Guyanese | 0.0 /100 | #269 | Tragic 13.3% |
| Cree | 0.0 /100 | #270 | Tragic 13.3% |
| Spanish Americans | 0.0 /100 | #271 | Tragic 13.4% |
| Immigrants | Bahamas | 0.0 /100 | #272 | Tragic 13.5% |
| Chickasaw | 0.0 /100 | #273 | Tragic 13.5% |
Demographics Similar to Somalis by Male Poverty
In terms of male poverty, the demographic groups most similar to Somalis are Seminole (14.3%, a difference of 0.20%), African (14.2%, a difference of 0.38%), Dutch West Indian (14.2%, a difference of 0.40%), Honduran (14.3%, a difference of 0.41%), and Choctaw (14.4%, a difference of 0.88%).
| Demographics | Rating | Rank | Male Poverty |
| Immigrants | Caribbean | 0.0 /100 | #302 | Tragic 14.0% |
| Bahamians | 0.0 /100 | #303 | Tragic 14.1% |
| Senegalese | 0.0 /100 | #304 | Tragic 14.1% |
| Immigrants | Bangladesh | 0.0 /100 | #305 | Tragic 14.1% |
| Creek | 0.0 /100 | #306 | Tragic 14.1% |
| Dutch West Indians | 0.0 /100 | #307 | Tragic 14.2% |
| Africans | 0.0 /100 | #308 | Tragic 14.2% |
| Somalis | 0.0 /100 | #309 | Tragic 14.3% |
| Seminole | 0.0 /100 | #310 | Tragic 14.3% |
| Hondurans | 0.0 /100 | #311 | Tragic 14.3% |
| Choctaw | 0.0 /100 | #312 | Tragic 14.4% |
| Immigrants | Somalia | 0.0 /100 | #313 | Tragic 14.6% |
| Immigrants | Honduras | 0.0 /100 | #314 | Tragic 14.6% |
| Chippewa | 0.0 /100 | #315 | Tragic 14.6% |
| British West Indians | 0.0 /100 | #316 | Tragic 14.6% |