Laotian vs Somali Male Poverty
COMPARE
Laotian
Somali
Male Poverty
Male Poverty Comparison
Laotians
Somalis
10.5%
MALE POVERTY
91.2/ 100
METRIC RATING
107th/ 347
METRIC RANK
14.3%
MALE POVERTY
0.0/ 100
METRIC RATING
309th/ 347
METRIC RANK
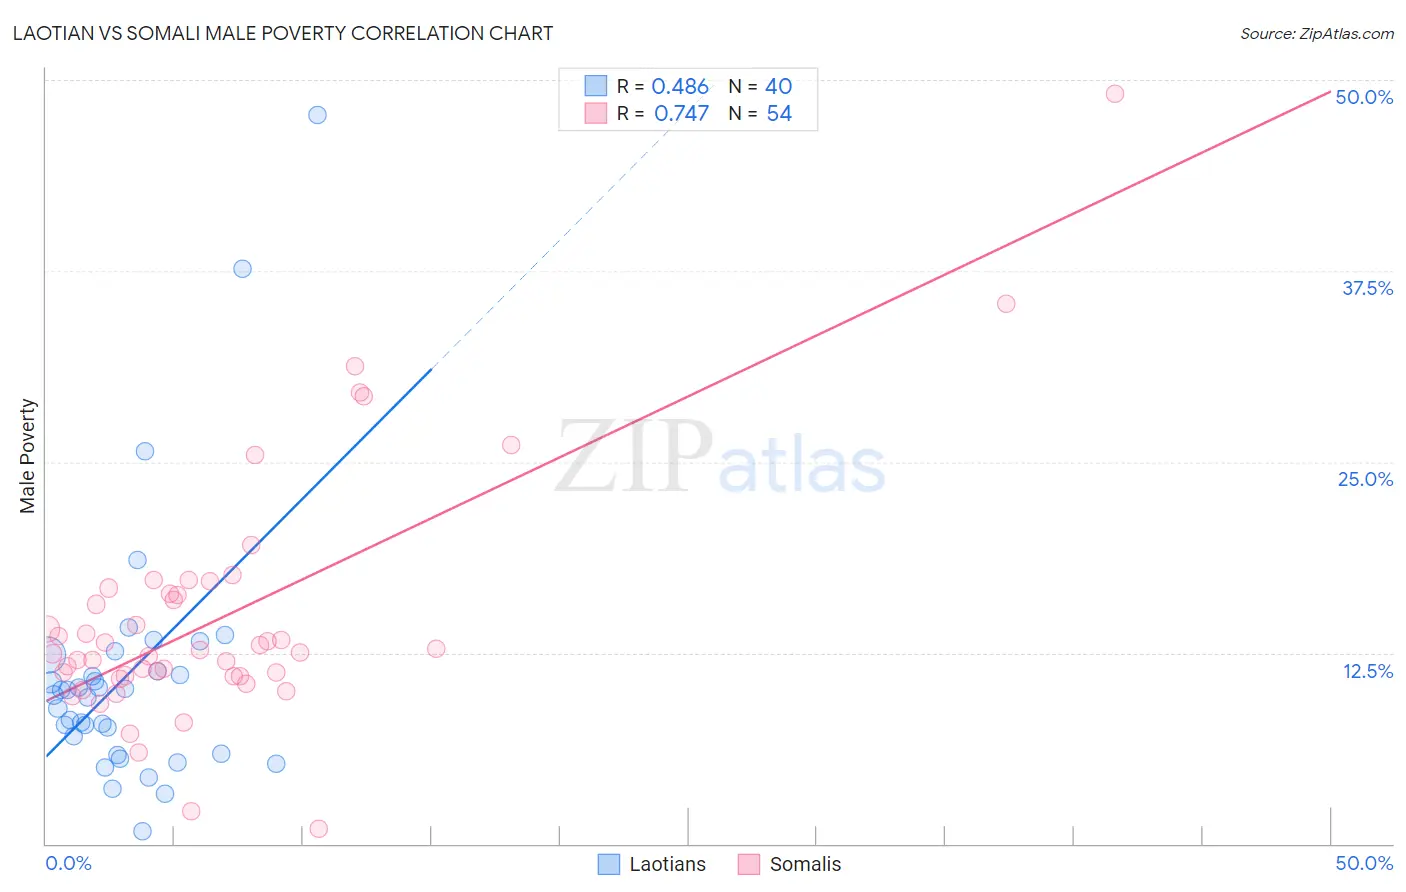
Laotian vs Somali Male Poverty Correlation Chart
The statistical analysis conducted on geographies consisting of 224,721,860 people shows a moderate positive correlation between the proportion of Laotians and poverty level among males in the United States with a correlation coefficient (R) of 0.486 and weighted average of 10.5%. Similarly, the statistical analysis conducted on geographies consisting of 99,289,063 people shows a strong positive correlation between the proportion of Somalis and poverty level among males in the United States with a correlation coefficient (R) of 0.747 and weighted average of 14.3%, a difference of 35.3%.
Male Poverty Correlation Summary
| Measurement | Laotian | Somali |
| Minimum | 0.78% | 1.0% |
| Maximum | 47.7% | 49.1% |
| Range | 46.9% | 48.1% |
| Mean | 11.0% | 14.8% |
| Median | 9.9% | 12.6% |
| Interquartile 25% (IQ1) | 6.5% | 10.9% |
| Interquartile 75% (IQ3) | 11.8% | 16.4% |
| Interquartile Range (IQR) | 5.4% | 5.4% |
| Standard Deviation (Sample) | 8.6% | 8.1% |
| Standard Deviation (Population) | 8.5% | 8.0% |
Similar Demographics by Male Poverty
Demographics Similar to Laotians by Male Poverty
In terms of male poverty, the demographic groups most similar to Laotians are Immigrants from Southern Europe (10.5%, a difference of 0.010%), Portuguese (10.6%, a difference of 0.070%), Canadian (10.5%, a difference of 0.12%), Welsh (10.5%, a difference of 0.13%), and Slavic (10.5%, a difference of 0.14%).
| Demographics | Rating | Rank | Male Poverty |
| Immigrants | Latvia | 92.8 /100 | #100 | Exceptional 10.5% |
| Immigrants | Zimbabwe | 92.0 /100 | #101 | Exceptional 10.5% |
| French Canadians | 91.9 /100 | #102 | Exceptional 10.5% |
| Slavs | 91.7 /100 | #103 | Exceptional 10.5% |
| Welsh | 91.6 /100 | #104 | Exceptional 10.5% |
| Canadians | 91.6 /100 | #105 | Exceptional 10.5% |
| Immigrants | Southern Europe | 91.3 /100 | #106 | Exceptional 10.5% |
| Laotians | 91.2 /100 | #107 | Exceptional 10.5% |
| Portuguese | 91.0 /100 | #108 | Exceptional 10.6% |
| Albanians | 90.6 /100 | #109 | Exceptional 10.6% |
| Argentineans | 90.1 /100 | #110 | Exceptional 10.6% |
| Immigrants | Argentina | 89.8 /100 | #111 | Excellent 10.6% |
| Immigrants | Turkey | 89.5 /100 | #112 | Excellent 10.6% |
| Palestinians | 89.1 /100 | #113 | Excellent 10.6% |
| Immigrants | Brazil | 89.0 /100 | #114 | Excellent 10.6% |
Demographics Similar to Somalis by Male Poverty
In terms of male poverty, the demographic groups most similar to Somalis are Seminole (14.3%, a difference of 0.20%), African (14.2%, a difference of 0.38%), Dutch West Indian (14.2%, a difference of 0.40%), Honduran (14.3%, a difference of 0.41%), and Choctaw (14.4%, a difference of 0.88%).
| Demographics | Rating | Rank | Male Poverty |
| Immigrants | Caribbean | 0.0 /100 | #302 | Tragic 14.0% |
| Bahamians | 0.0 /100 | #303 | Tragic 14.1% |
| Senegalese | 0.0 /100 | #304 | Tragic 14.1% |
| Immigrants | Bangladesh | 0.0 /100 | #305 | Tragic 14.1% |
| Creek | 0.0 /100 | #306 | Tragic 14.1% |
| Dutch West Indians | 0.0 /100 | #307 | Tragic 14.2% |
| Africans | 0.0 /100 | #308 | Tragic 14.2% |
| Somalis | 0.0 /100 | #309 | Tragic 14.3% |
| Seminole | 0.0 /100 | #310 | Tragic 14.3% |
| Hondurans | 0.0 /100 | #311 | Tragic 14.3% |
| Choctaw | 0.0 /100 | #312 | Tragic 14.4% |
| Immigrants | Somalia | 0.0 /100 | #313 | Tragic 14.6% |
| Immigrants | Honduras | 0.0 /100 | #314 | Tragic 14.6% |
| Chippewa | 0.0 /100 | #315 | Tragic 14.6% |
| British West Indians | 0.0 /100 | #316 | Tragic 14.6% |