Immigrants from Peru vs Somali Male Poverty
COMPARE
Immigrants from Peru
Somali
Male Poverty
Male Poverty Comparison
Immigrants from Peru
Somalis
10.7%
MALE POVERTY
84.1/ 100
METRIC RATING
129th/ 347
METRIC RANK
14.3%
MALE POVERTY
0.0/ 100
METRIC RATING
309th/ 347
METRIC RANK
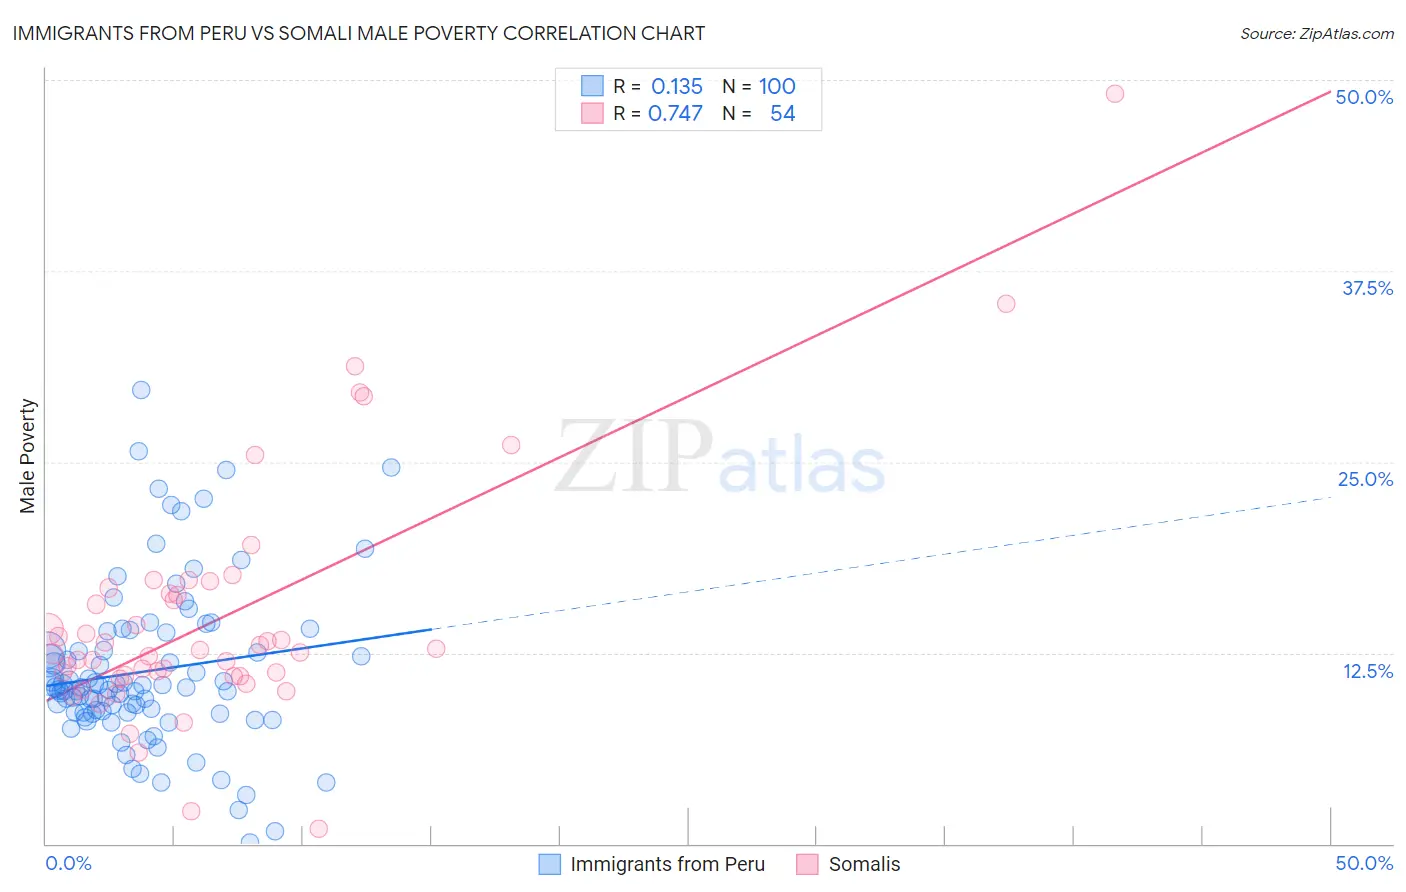
Immigrants from Peru vs Somali Male Poverty Correlation Chart
The statistical analysis conducted on geographies consisting of 328,672,815 people shows a poor positive correlation between the proportion of Immigrants from Peru and poverty level among males in the United States with a correlation coefficient (R) of 0.135 and weighted average of 10.7%. Similarly, the statistical analysis conducted on geographies consisting of 99,289,063 people shows a strong positive correlation between the proportion of Somalis and poverty level among males in the United States with a correlation coefficient (R) of 0.747 and weighted average of 14.3%, a difference of 32.9%.
Male Poverty Correlation Summary
| Measurement | Immigrants from Peru | Somali |
| Minimum | 0.066% | 1.0% |
| Maximum | 29.7% | 49.1% |
| Range | 29.6% | 48.1% |
| Mean | 11.3% | 14.8% |
| Median | 10.2% | 12.6% |
| Interquartile 25% (IQ1) | 8.6% | 10.9% |
| Interquartile 75% (IQ3) | 13.3% | 16.4% |
| Interquartile Range (IQR) | 4.7% | 5.4% |
| Standard Deviation (Sample) | 5.3% | 8.1% |
| Standard Deviation (Population) | 5.3% | 8.0% |
Similar Demographics by Male Poverty
Demographics Similar to Immigrants from Peru by Male Poverty
In terms of male poverty, the demographic groups most similar to Immigrants from Peru are Immigrants from Western Europe (10.7%, a difference of 0.010%), Immigrants from Ukraine (10.7%, a difference of 0.030%), Puget Sound Salish (10.7%, a difference of 0.030%), Chilean (10.7%, a difference of 0.050%), and Immigrants from Belarus (10.7%, a difference of 0.15%).
| Demographics | Rating | Rank | Male Poverty |
| Native Hawaiians | 87.0 /100 | #122 | Excellent 10.7% |
| South Africans | 86.8 /100 | #123 | Excellent 10.7% |
| French | 86.7 /100 | #124 | Excellent 10.7% |
| Immigrants | Norway | 86.0 /100 | #125 | Excellent 10.7% |
| Immigrants | Ukraine | 84.3 /100 | #126 | Excellent 10.7% |
| Puget Sound Salish | 84.3 /100 | #127 | Excellent 10.7% |
| Immigrants | Western Europe | 84.2 /100 | #128 | Excellent 10.7% |
| Immigrants | Peru | 84.1 /100 | #129 | Excellent 10.7% |
| Chileans | 83.9 /100 | #130 | Excellent 10.7% |
| Immigrants | Belarus | 83.3 /100 | #131 | Excellent 10.7% |
| Immigrants | Vietnam | 83.0 /100 | #132 | Excellent 10.8% |
| Pakistanis | 83.0 /100 | #133 | Excellent 10.8% |
| New Zealanders | 82.9 /100 | #134 | Excellent 10.8% |
| Brazilians | 82.7 /100 | #135 | Excellent 10.8% |
| Immigrants | Israel | 80.9 /100 | #136 | Excellent 10.8% |
Demographics Similar to Somalis by Male Poverty
In terms of male poverty, the demographic groups most similar to Somalis are Seminole (14.3%, a difference of 0.20%), African (14.2%, a difference of 0.38%), Dutch West Indian (14.2%, a difference of 0.40%), Honduran (14.3%, a difference of 0.41%), and Choctaw (14.4%, a difference of 0.88%).
| Demographics | Rating | Rank | Male Poverty |
| Immigrants | Caribbean | 0.0 /100 | #302 | Tragic 14.0% |
| Bahamians | 0.0 /100 | #303 | Tragic 14.1% |
| Senegalese | 0.0 /100 | #304 | Tragic 14.1% |
| Immigrants | Bangladesh | 0.0 /100 | #305 | Tragic 14.1% |
| Creek | 0.0 /100 | #306 | Tragic 14.1% |
| Dutch West Indians | 0.0 /100 | #307 | Tragic 14.2% |
| Africans | 0.0 /100 | #308 | Tragic 14.2% |
| Somalis | 0.0 /100 | #309 | Tragic 14.3% |
| Seminole | 0.0 /100 | #310 | Tragic 14.3% |
| Hondurans | 0.0 /100 | #311 | Tragic 14.3% |
| Choctaw | 0.0 /100 | #312 | Tragic 14.4% |
| Immigrants | Somalia | 0.0 /100 | #313 | Tragic 14.6% |
| Immigrants | Honduras | 0.0 /100 | #314 | Tragic 14.6% |
| Chippewa | 0.0 /100 | #315 | Tragic 14.6% |
| British West Indians | 0.0 /100 | #316 | Tragic 14.6% |