Immigrants from Guyana vs Somali 7th Grade
COMPARE
Immigrants from Guyana
Somali
7th Grade
7th Grade Comparison
Immigrants from Guyana
Somalis
94.2%
7TH GRADE
0.0/ 100
METRIC RATING
306th/ 347
METRIC RANK
95.3%
7TH GRADE
0.9/ 100
METRIC RATING
253rd/ 347
METRIC RANK
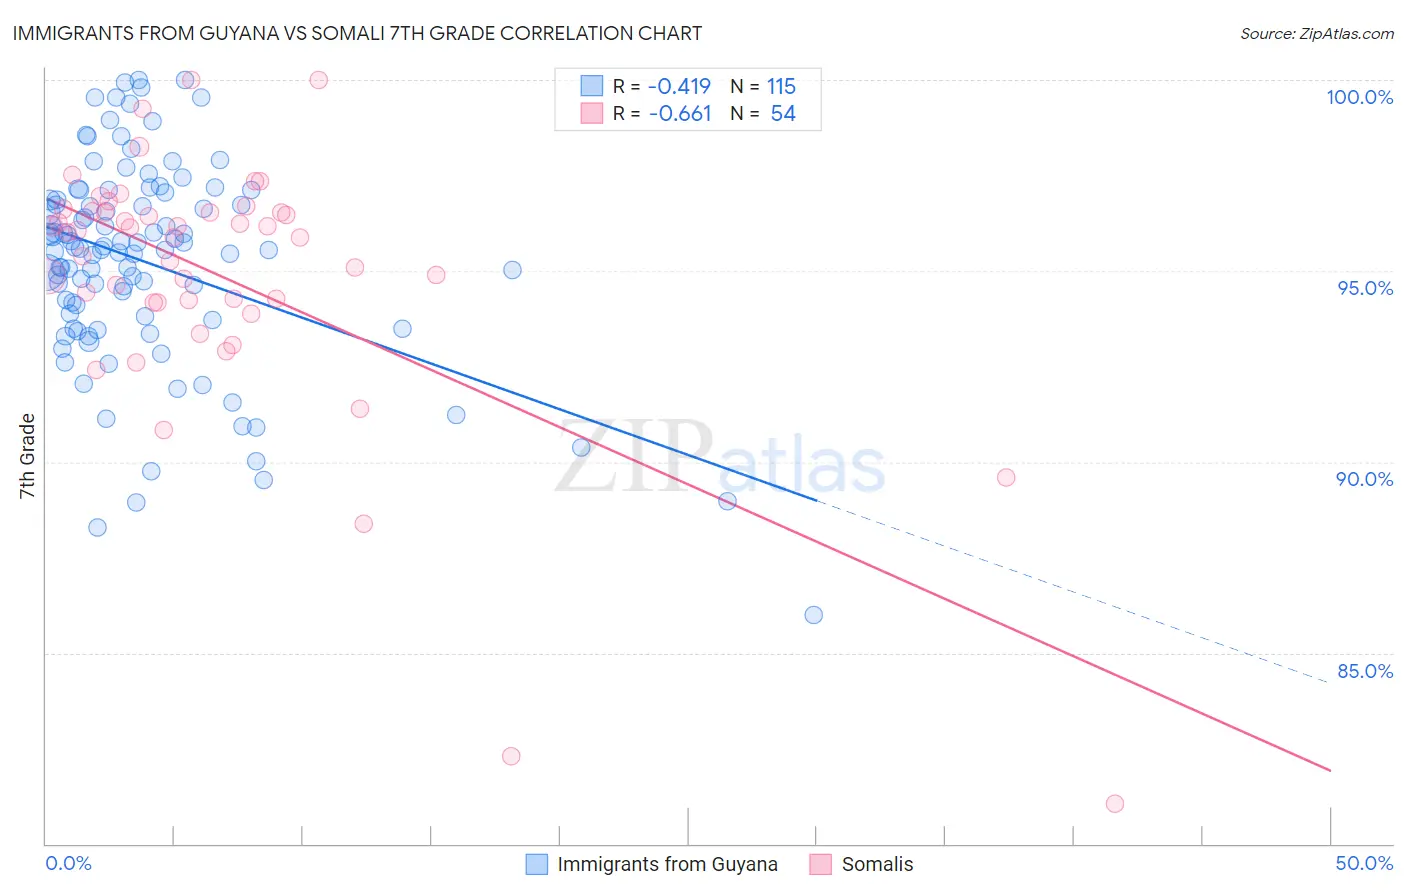
Immigrants from Guyana vs Somali 7th Grade Correlation Chart
The statistical analysis conducted on geographies consisting of 183,673,461 people shows a moderate negative correlation between the proportion of Immigrants from Guyana and percentage of population with at least 7th grade education in the United States with a correlation coefficient (R) of -0.419 and weighted average of 94.2%. Similarly, the statistical analysis conducted on geographies consisting of 99,332,457 people shows a significant negative correlation between the proportion of Somalis and percentage of population with at least 7th grade education in the United States with a correlation coefficient (R) of -0.661 and weighted average of 95.3%, a difference of 1.2%.
7th Grade Correlation Summary
| Measurement | Immigrants from Guyana | Somali |
| Minimum | 86.0% | 81.1% |
| Maximum | 100.0% | 100.0% |
| Range | 14.0% | 18.9% |
| Mean | 95.2% | 94.9% |
| Median | 95.5% | 95.9% |
| Interquartile 25% (IQ1) | 93.7% | 94.2% |
| Interquartile 75% (IQ3) | 96.9% | 96.5% |
| Interquartile Range (IQR) | 3.1% | 2.4% |
| Standard Deviation (Sample) | 2.7% | 3.4% |
| Standard Deviation (Population) | 2.7% | 3.4% |
Similar Demographics by 7th Grade
Demographics Similar to Immigrants from Guyana by 7th Grade
In terms of 7th grade, the demographic groups most similar to Immigrants from Guyana are Immigrants from Portugal (94.2%, a difference of 0.020%), Cape Verdean (94.1%, a difference of 0.10%), Guyanese (94.3%, a difference of 0.13%), Immigrants from Haiti (94.3%, a difference of 0.15%), and Ecuadorian (94.0%, a difference of 0.16%).
| Demographics | Rating | Rank | 7th Grade |
| Bangladeshis | 0.0 /100 | #299 | Tragic 94.5% |
| Immigrants | Burma/Myanmar | 0.0 /100 | #300 | Tragic 94.5% |
| Immigrants | Dominica | 0.0 /100 | #301 | Tragic 94.5% |
| Immigrants | Laos | 0.0 /100 | #302 | Tragic 94.5% |
| Sri Lankans | 0.0 /100 | #303 | Tragic 94.4% |
| Immigrants | Haiti | 0.0 /100 | #304 | Tragic 94.3% |
| Guyanese | 0.0 /100 | #305 | Tragic 94.3% |
| Immigrants | Guyana | 0.0 /100 | #306 | Tragic 94.2% |
| Immigrants | Portugal | 0.0 /100 | #307 | Tragic 94.2% |
| Cape Verdeans | 0.0 /100 | #308 | Tragic 94.1% |
| Ecuadorians | 0.0 /100 | #309 | Tragic 94.0% |
| Immigrants | Caribbean | 0.0 /100 | #310 | Tragic 94.0% |
| Puerto Ricans | 0.0 /100 | #311 | Tragic 94.0% |
| Immigrants | Immigrants | 0.0 /100 | #312 | Tragic 94.0% |
| Immigrants | Bangladesh | 0.0 /100 | #313 | Tragic 94.0% |
Demographics Similar to Somalis by 7th Grade
In terms of 7th grade, the demographic groups most similar to Somalis are Immigrants from Cameroon (95.4%, a difference of 0.010%), Immigrants from Jamaica (95.4%, a difference of 0.010%), Immigrants from Ethiopia (95.3%, a difference of 0.010%), Colombian (95.3%, a difference of 0.010%), and Korean (95.3%, a difference of 0.020%).
| Demographics | Rating | Rank | 7th Grade |
| Ethiopians | 1.5 /100 | #246 | Tragic 95.4% |
| Tongans | 1.3 /100 | #247 | Tragic 95.4% |
| Paiute | 1.2 /100 | #248 | Tragic 95.4% |
| Bolivians | 1.1 /100 | #249 | Tragic 95.4% |
| Immigrants | Cameroon | 0.9 /100 | #250 | Tragic 95.4% |
| Immigrants | Jamaica | 0.9 /100 | #251 | Tragic 95.4% |
| Immigrants | Ethiopia | 0.9 /100 | #252 | Tragic 95.3% |
| Somalis | 0.9 /100 | #253 | Tragic 95.3% |
| Colombians | 0.8 /100 | #254 | Tragic 95.3% |
| Koreans | 0.8 /100 | #255 | Tragic 95.3% |
| Immigrants | China | 0.7 /100 | #256 | Tragic 95.3% |
| Immigrants | Congo | 0.7 /100 | #257 | Tragic 95.3% |
| Ghanaians | 0.7 /100 | #258 | Tragic 95.3% |
| Immigrants | Costa Rica | 0.6 /100 | #259 | Tragic 95.3% |
| Afghans | 0.5 /100 | #260 | Tragic 95.3% |