Immigrants from Guyana vs Immigrants from St. Vincent and the Grenadines Single Father Poverty
COMPARE
Immigrants from Guyana
Immigrants from St. Vincent and the Grenadines
Single Father Poverty
Single Father Poverty Comparison
Immigrants from Guyana
Immigrants from St. Vincent and the Grenadines
16.5%
SINGLE FATHER POVERTY
27.1/ 100
METRIC RATING
191st/ 347
METRIC RANK
16.3%
SINGLE FATHER POVERTY
50.0/ 100
METRIC RATING
173rd/ 347
METRIC RANK
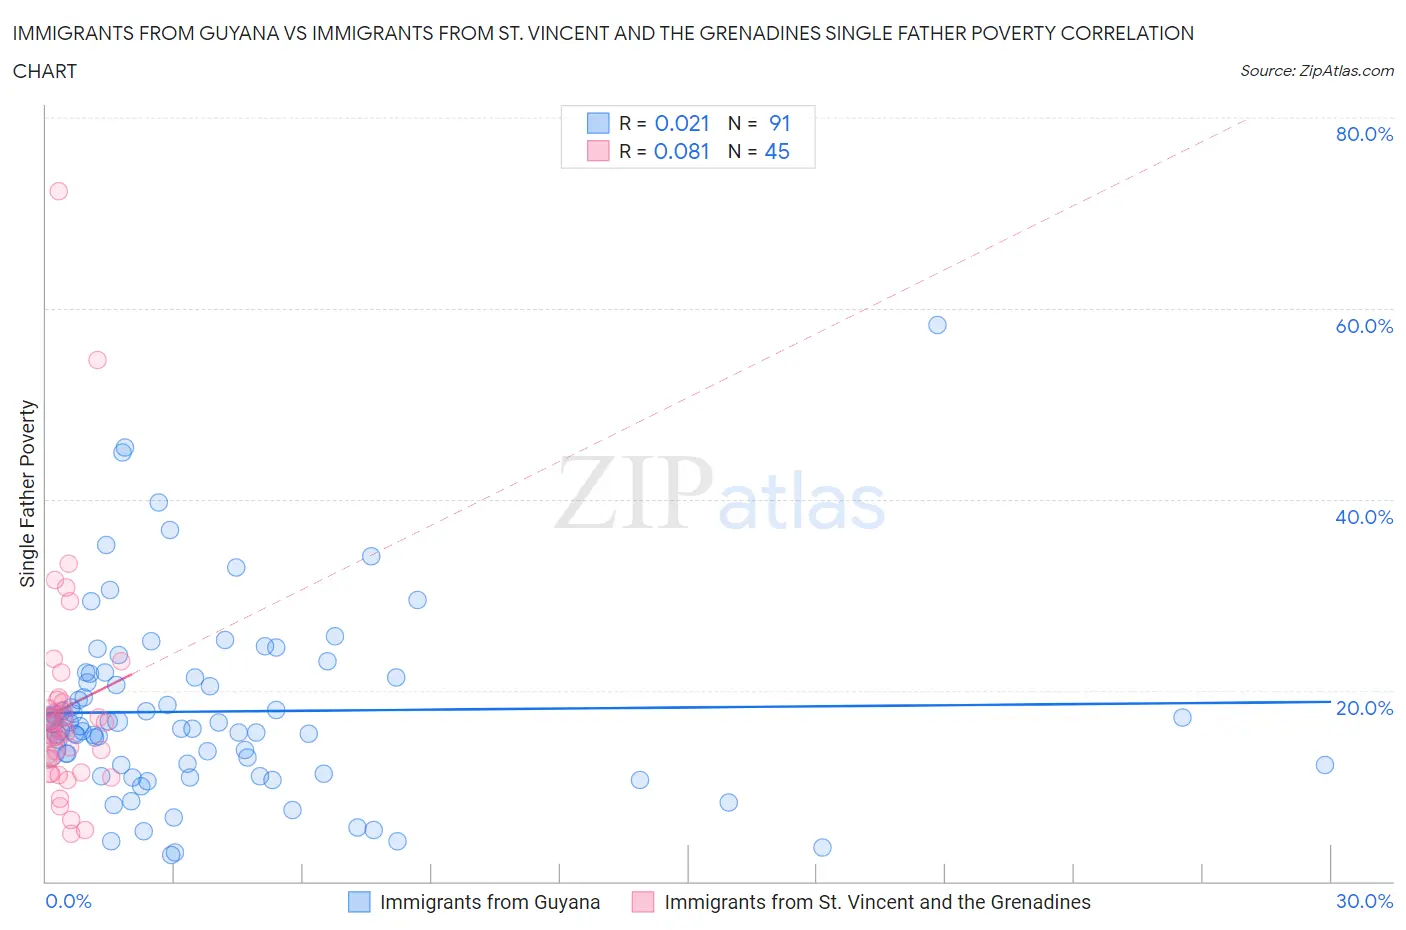
Immigrants from Guyana vs Immigrants from St. Vincent and the Grenadines Single Father Poverty Correlation Chart
The statistical analysis conducted on geographies consisting of 157,234,374 people shows no correlation between the proportion of Immigrants from Guyana and poverty level among single fathers in the United States with a correlation coefficient (R) of 0.021 and weighted average of 16.5%. Similarly, the statistical analysis conducted on geographies consisting of 52,217,321 people shows a slight positive correlation between the proportion of Immigrants from St. Vincent and the Grenadines and poverty level among single fathers in the United States with a correlation coefficient (R) of 0.081 and weighted average of 16.3%, a difference of 1.1%.
Single Father Poverty Correlation Summary
| Measurement | Immigrants from Guyana | Immigrants from St. Vincent and the Grenadines |
| Minimum | 2.8% | 5.0% |
| Maximum | 58.2% | 72.3% |
| Range | 55.4% | 67.3% |
| Mean | 17.8% | 18.2% |
| Median | 16.3% | 15.8% |
| Interquartile 25% (IQ1) | 12.2% | 12.1% |
| Interquartile 75% (IQ3) | 21.3% | 18.9% |
| Interquartile Range (IQR) | 9.1% | 6.8% |
| Standard Deviation (Sample) | 9.7% | 11.9% |
| Standard Deviation (Population) | 9.6% | 11.7% |
Demographics Similar to Immigrants from Guyana and Immigrants from St. Vincent and the Grenadines by Single Father Poverty
In terms of single father poverty, the demographic groups most similar to Immigrants from Guyana are Immigrants from Burma/Myanmar (16.5%, a difference of 0.050%), Latvian (16.5%, a difference of 0.10%), Immigrants from Switzerland (16.5%, a difference of 0.13%), Russian (16.4%, a difference of 0.16%), and Ukrainian (16.4%, a difference of 0.17%). Similarly, the demographic groups most similar to Immigrants from St. Vincent and the Grenadines are Immigrants from Sierra Leone (16.3%, a difference of 0.0%), Swedish (16.3%, a difference of 0.0%), Immigrants from Ecuador (16.3%, a difference of 0.020%), Vietnamese (16.3%, a difference of 0.090%), and Immigrants from South Africa (16.3%, a difference of 0.26%).
| Demographics | Rating | Rank | Single Father Poverty |
| Immigrants | Sierra Leone | 50.1 /100 | #172 | Average 16.3% |
| Immigrants | St. Vincent and the Grenadines | 50.0 /100 | #173 | Average 16.3% |
| Swedes | 50.0 /100 | #174 | Average 16.3% |
| Immigrants | Ecuador | 49.7 /100 | #175 | Average 16.3% |
| Vietnamese | 48.0 /100 | #176 | Average 16.3% |
| Immigrants | South Africa | 44.2 /100 | #177 | Average 16.3% |
| Immigrants | Cuba | 41.6 /100 | #178 | Average 16.4% |
| Serbians | 40.9 /100 | #179 | Average 16.4% |
| Immigrants | Latin America | 37.2 /100 | #180 | Fair 16.4% |
| Immigrants | Western Africa | 36.0 /100 | #181 | Fair 16.4% |
| Immigrants | Italy | 35.7 /100 | #182 | Fair 16.4% |
| Aleuts | 35.3 /100 | #183 | Fair 16.4% |
| Cambodians | 34.6 /100 | #184 | Fair 16.4% |
| Panamanians | 33.6 /100 | #185 | Fair 16.4% |
| Immigrants | Venezuela | 31.0 /100 | #186 | Fair 16.4% |
| Ukrainians | 30.4 /100 | #187 | Fair 16.4% |
| Russians | 30.1 /100 | #188 | Fair 16.4% |
| Latvians | 28.9 /100 | #189 | Fair 16.5% |
| Immigrants | Burma/Myanmar | 28.0 /100 | #190 | Fair 16.5% |
| Immigrants | Guyana | 27.1 /100 | #191 | Fair 16.5% |
| Immigrants | Switzerland | 24.8 /100 | #192 | Fair 16.5% |