Immigrants from Guyana vs White/Caucasian Single Father Poverty
COMPARE
Immigrants from Guyana
White/Caucasian
Single Father Poverty
Single Father Poverty Comparison
Immigrants from Guyana
Whites/Caucasians
16.5%
SINGLE FATHER POVERTY
27.1/ 100
METRIC RATING
191st/ 347
METRIC RANK
18.4%
SINGLE FATHER POVERTY
0.0/ 100
METRIC RATING
299th/ 347
METRIC RANK
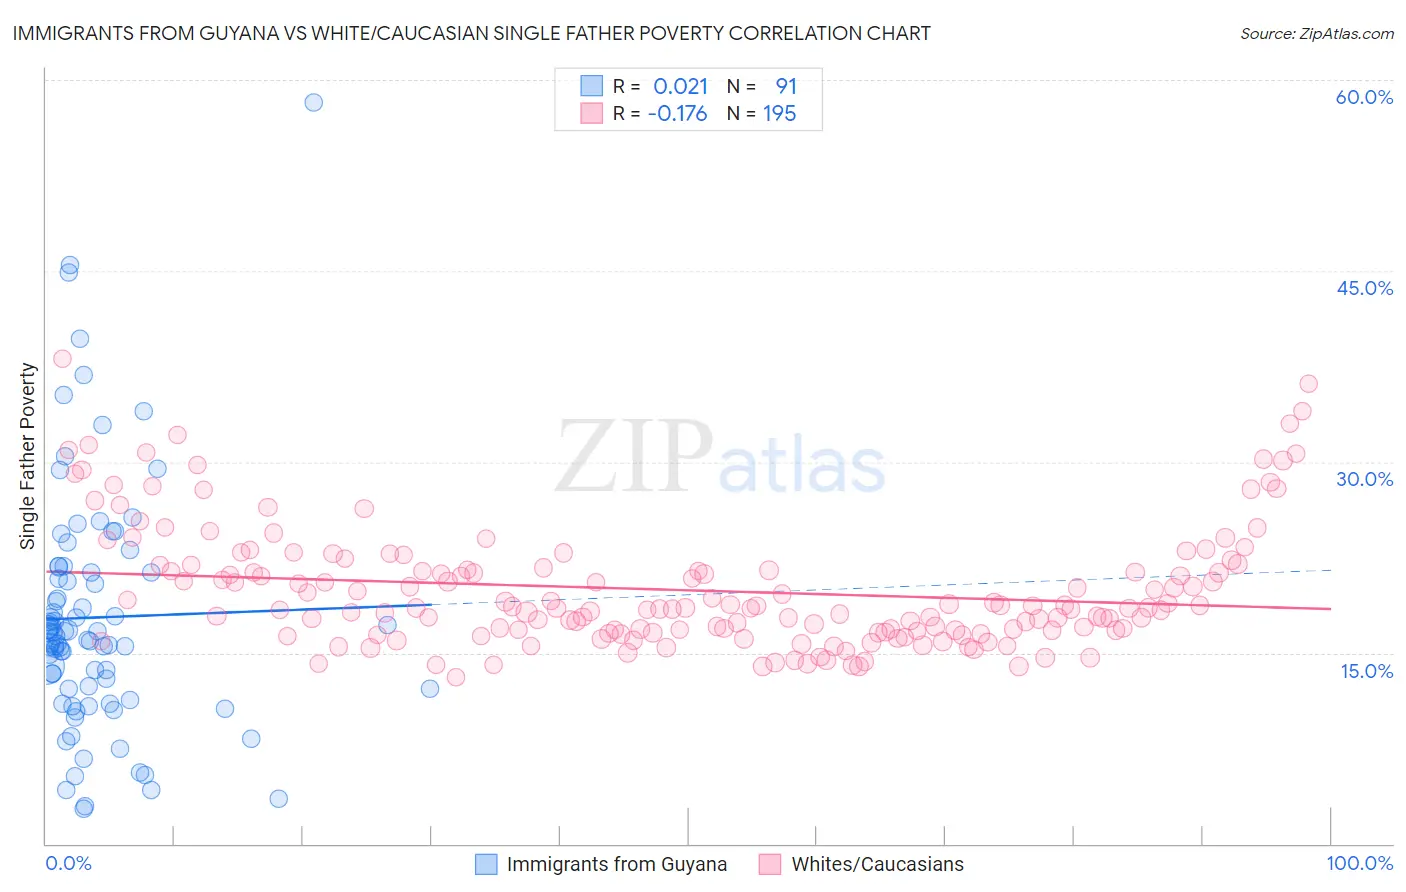
Immigrants from Guyana vs White/Caucasian Single Father Poverty Correlation Chart
The statistical analysis conducted on geographies consisting of 157,234,374 people shows no correlation between the proportion of Immigrants from Guyana and poverty level among single fathers in the United States with a correlation coefficient (R) of 0.021 and weighted average of 16.5%. Similarly, the statistical analysis conducted on geographies consisting of 414,032,364 people shows a poor negative correlation between the proportion of Whites/Caucasians and poverty level among single fathers in the United States with a correlation coefficient (R) of -0.176 and weighted average of 18.4%, a difference of 11.4%.
Single Father Poverty Correlation Summary
| Measurement | Immigrants from Guyana | White/Caucasian |
| Minimum | 2.8% | 13.1% |
| Maximum | 58.2% | 38.1% |
| Range | 55.4% | 25.0% |
| Mean | 17.8% | 19.9% |
| Median | 16.3% | 18.5% |
| Interquartile 25% (IQ1) | 12.2% | 16.7% |
| Interquartile 75% (IQ3) | 21.3% | 21.7% |
| Interquartile Range (IQR) | 9.1% | 5.0% |
| Standard Deviation (Sample) | 9.7% | 4.7% |
| Standard Deviation (Population) | 9.6% | 4.7% |
Similar Demographics by Single Father Poverty
Demographics Similar to Immigrants from Guyana by Single Father Poverty
In terms of single father poverty, the demographic groups most similar to Immigrants from Guyana are Immigrants from Burma/Myanmar (16.5%, a difference of 0.050%), Latvian (16.5%, a difference of 0.10%), Immigrants from Switzerland (16.5%, a difference of 0.13%), Ecuadorian (16.5%, a difference of 0.15%), and Russian (16.4%, a difference of 0.16%).
| Demographics | Rating | Rank | Single Father Poverty |
| Cambodians | 34.6 /100 | #184 | Fair 16.4% |
| Panamanians | 33.6 /100 | #185 | Fair 16.4% |
| Immigrants | Venezuela | 31.0 /100 | #186 | Fair 16.4% |
| Ukrainians | 30.4 /100 | #187 | Fair 16.4% |
| Russians | 30.1 /100 | #188 | Fair 16.4% |
| Latvians | 28.9 /100 | #189 | Fair 16.5% |
| Immigrants | Burma/Myanmar | 28.0 /100 | #190 | Fair 16.5% |
| Immigrants | Guyana | 27.1 /100 | #191 | Fair 16.5% |
| Immigrants | Switzerland | 24.8 /100 | #192 | Fair 16.5% |
| Ecuadorians | 24.5 /100 | #193 | Fair 16.5% |
| Cape Verdeans | 24.4 /100 | #194 | Fair 16.5% |
| Immigrants | Barbados | 24.3 /100 | #195 | Fair 16.5% |
| Immigrants | Canada | 21.9 /100 | #196 | Fair 16.5% |
| Immigrants | Northern Europe | 20.3 /100 | #197 | Fair 16.5% |
| Romanians | 20.1 /100 | #198 | Fair 16.5% |
Demographics Similar to Whites/Caucasians by Single Father Poverty
In terms of single father poverty, the demographic groups most similar to Whites/Caucasians are African (18.3%, a difference of 0.21%), Immigrants from Dominican Republic (18.4%, a difference of 0.32%), Hungarian (18.5%, a difference of 0.53%), Comanche (18.5%, a difference of 0.64%), and Celtic (18.5%, a difference of 0.68%).
| Demographics | Rating | Rank | Single Father Poverty |
| Immigrants | Bahamas | 0.0 /100 | #292 | Tragic 18.1% |
| Alaska Natives | 0.0 /100 | #293 | Tragic 18.1% |
| U.S. Virgin Islanders | 0.0 /100 | #294 | Tragic 18.1% |
| Yakama | 0.0 /100 | #295 | Tragic 18.1% |
| Seminole | 0.0 /100 | #296 | Tragic 18.1% |
| French | 0.0 /100 | #297 | Tragic 18.2% |
| Africans | 0.0 /100 | #298 | Tragic 18.3% |
| Whites/Caucasians | 0.0 /100 | #299 | Tragic 18.4% |
| Immigrants | Dominican Republic | 0.0 /100 | #300 | Tragic 18.4% |
| Hungarians | 0.0 /100 | #301 | Tragic 18.5% |
| Comanche | 0.0 /100 | #302 | Tragic 18.5% |
| Celtics | 0.0 /100 | #303 | Tragic 18.5% |
| Ute | 0.0 /100 | #304 | Tragic 18.5% |
| Blackfeet | 0.0 /100 | #305 | Tragic 18.5% |
| Scotch-Irish | 0.0 /100 | #306 | Tragic 18.6% |