New Zealander vs Panamanian Female Poverty
COMPARE
New Zealander
Panamanian
Female Poverty
Female Poverty Comparison
New Zealanders
Panamanians
12.7%
FEMALE POVERTY
90.6/ 100
METRIC RATING
120th/ 347
METRIC RANK
14.2%
FEMALE POVERTY
7.7/ 100
METRIC RATING
209th/ 347
METRIC RANK
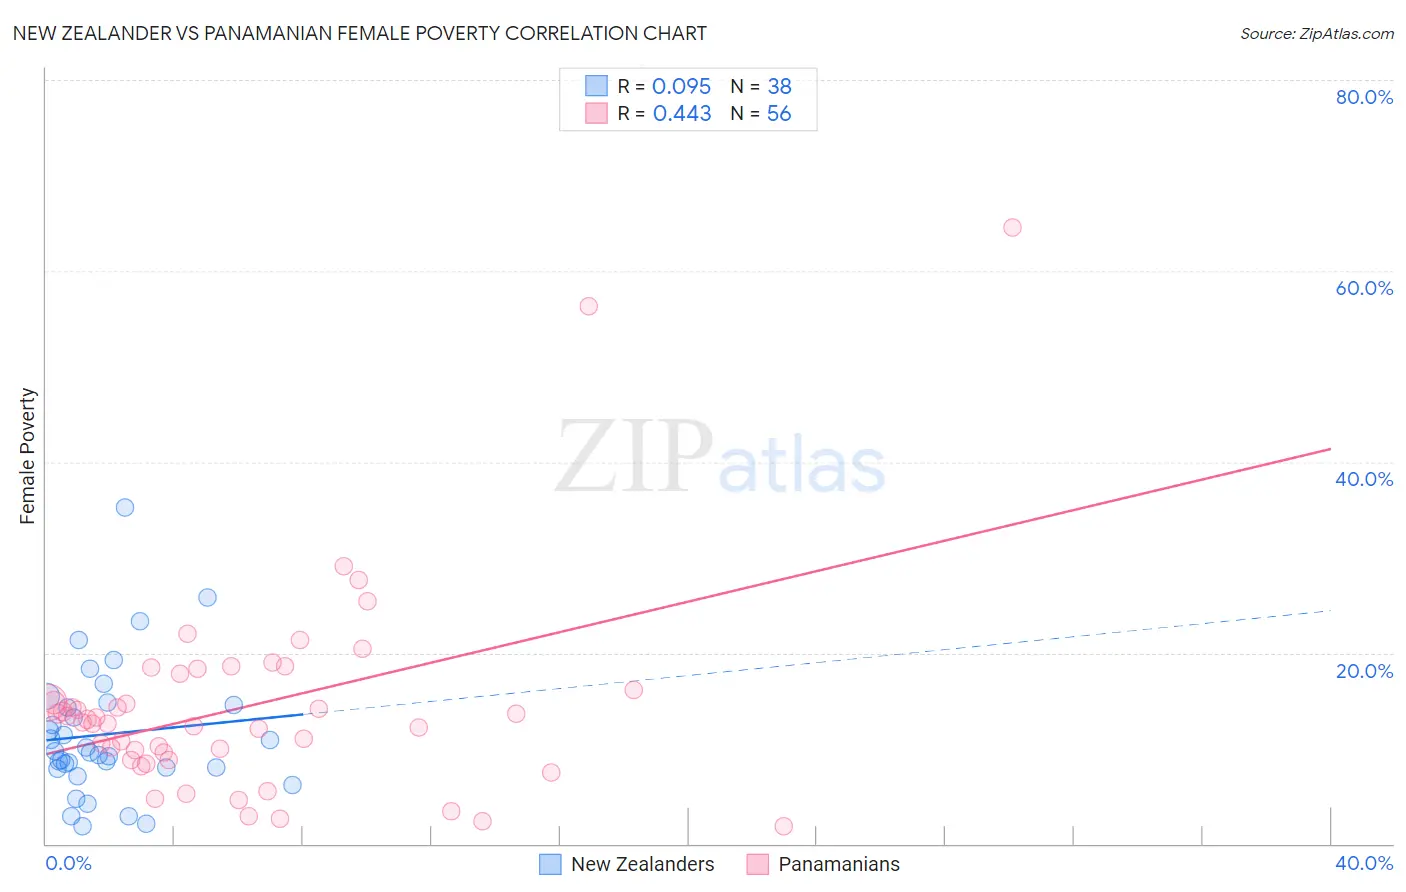
New Zealander vs Panamanian Female Poverty Correlation Chart
The statistical analysis conducted on geographies consisting of 106,893,684 people shows a slight positive correlation between the proportion of New Zealanders and poverty level among females in the United States with a correlation coefficient (R) of 0.095 and weighted average of 12.7%. Similarly, the statistical analysis conducted on geographies consisting of 281,053,413 people shows a moderate positive correlation between the proportion of Panamanians and poverty level among females in the United States with a correlation coefficient (R) of 0.443 and weighted average of 14.2%, a difference of 12.1%.
Female Poverty Correlation Summary
| Measurement | New Zealander | Panamanian |
| Minimum | 1.9% | 1.9% |
| Maximum | 35.3% | 64.6% |
| Range | 33.4% | 62.7% |
| Mean | 11.5% | 14.4% |
| Median | 9.6% | 12.9% |
| Interquartile 25% (IQ1) | 8.0% | 9.2% |
| Interquartile 75% (IQ3) | 14.5% | 17.0% |
| Interquartile Range (IQR) | 6.5% | 7.8% |
| Standard Deviation (Sample) | 6.9% | 10.8% |
| Standard Deviation (Population) | 6.8% | 10.7% |
Similar Demographics by Female Poverty
Demographics Similar to New Zealanders by Female Poverty
In terms of female poverty, the demographic groups most similar to New Zealanders are Albanian (12.7%, a difference of 0.060%), Sri Lankan (12.7%, a difference of 0.070%), Immigrants from Southern Europe (12.7%, a difference of 0.090%), Immigrants from Hungary (12.7%, a difference of 0.10%), and French Canadian (12.7%, a difference of 0.14%).
| Demographics | Rating | Rank | Female Poverty |
| Canadians | 92.0 /100 | #113 | Exceptional 12.7% |
| Welsh | 91.6 /100 | #114 | Exceptional 12.7% |
| Puget Sound Salish | 91.5 /100 | #115 | Exceptional 12.7% |
| Immigrants | Russia | 91.2 /100 | #116 | Exceptional 12.7% |
| Immigrants | Southern Europe | 90.9 /100 | #117 | Exceptional 12.7% |
| Sri Lankans | 90.9 /100 | #118 | Exceptional 12.7% |
| Albanians | 90.8 /100 | #119 | Exceptional 12.7% |
| New Zealanders | 90.6 /100 | #120 | Exceptional 12.7% |
| Immigrants | Hungary | 90.3 /100 | #121 | Exceptional 12.7% |
| French Canadians | 90.2 /100 | #122 | Exceptional 12.7% |
| Immigrants | South Eastern Asia | 89.9 /100 | #123 | Excellent 12.7% |
| Immigrants | Norway | 89.3 /100 | #124 | Excellent 12.8% |
| Argentineans | 89.1 /100 | #125 | Excellent 12.8% |
| Immigrants | Ukraine | 88.8 /100 | #126 | Excellent 12.8% |
| South Africans | 88.4 /100 | #127 | Excellent 12.8% |
Demographics Similar to Panamanians by Female Poverty
In terms of female poverty, the demographic groups most similar to Panamanians are Immigrants from the Azores (14.2%, a difference of 0.060%), Malaysian (14.3%, a difference of 0.080%), Moroccan (14.3%, a difference of 0.17%), Immigrants from Eastern Africa (14.2%, a difference of 0.41%), and Bermudan (14.4%, a difference of 0.80%).
| Demographics | Rating | Rank | Female Poverty |
| Hmong | 21.1 /100 | #202 | Fair 13.9% |
| Immigrants | Western Asia | 20.7 /100 | #203 | Fair 13.9% |
| Spaniards | 18.9 /100 | #204 | Poor 13.9% |
| Ugandans | 15.4 /100 | #205 | Poor 14.0% |
| Immigrants | Uruguay | 14.0 /100 | #206 | Poor 14.0% |
| Immigrants | Eastern Africa | 9.0 /100 | #207 | Tragic 14.2% |
| Immigrants | Azores | 7.9 /100 | #208 | Tragic 14.2% |
| Panamanians | 7.7 /100 | #209 | Tragic 14.2% |
| Malaysians | 7.4 /100 | #210 | Tragic 14.3% |
| Moroccans | 7.2 /100 | #211 | Tragic 14.3% |
| Bermudans | 5.5 /100 | #212 | Tragic 14.4% |
| Alaskan Athabascans | 5.3 /100 | #213 | Tragic 14.4% |
| Marshallese | 5.0 /100 | #214 | Tragic 14.4% |
| Immigrants | Panama | 4.7 /100 | #215 | Tragic 14.4% |
| Immigrants | Thailand | 4.5 /100 | #216 | Tragic 14.4% |