Immigrants from Fiji vs Yaqui 3rd Grade
COMPARE
Immigrants from Fiji
Yaqui
3rd Grade
3rd Grade Comparison
Immigrants from Fiji
Yaqui
96.2%
3RD GRADE
0.0/ 100
METRIC RATING
333rd/ 347
METRIC RANK
97.3%
3RD GRADE
0.3/ 100
METRIC RATING
266th/ 347
METRIC RANK
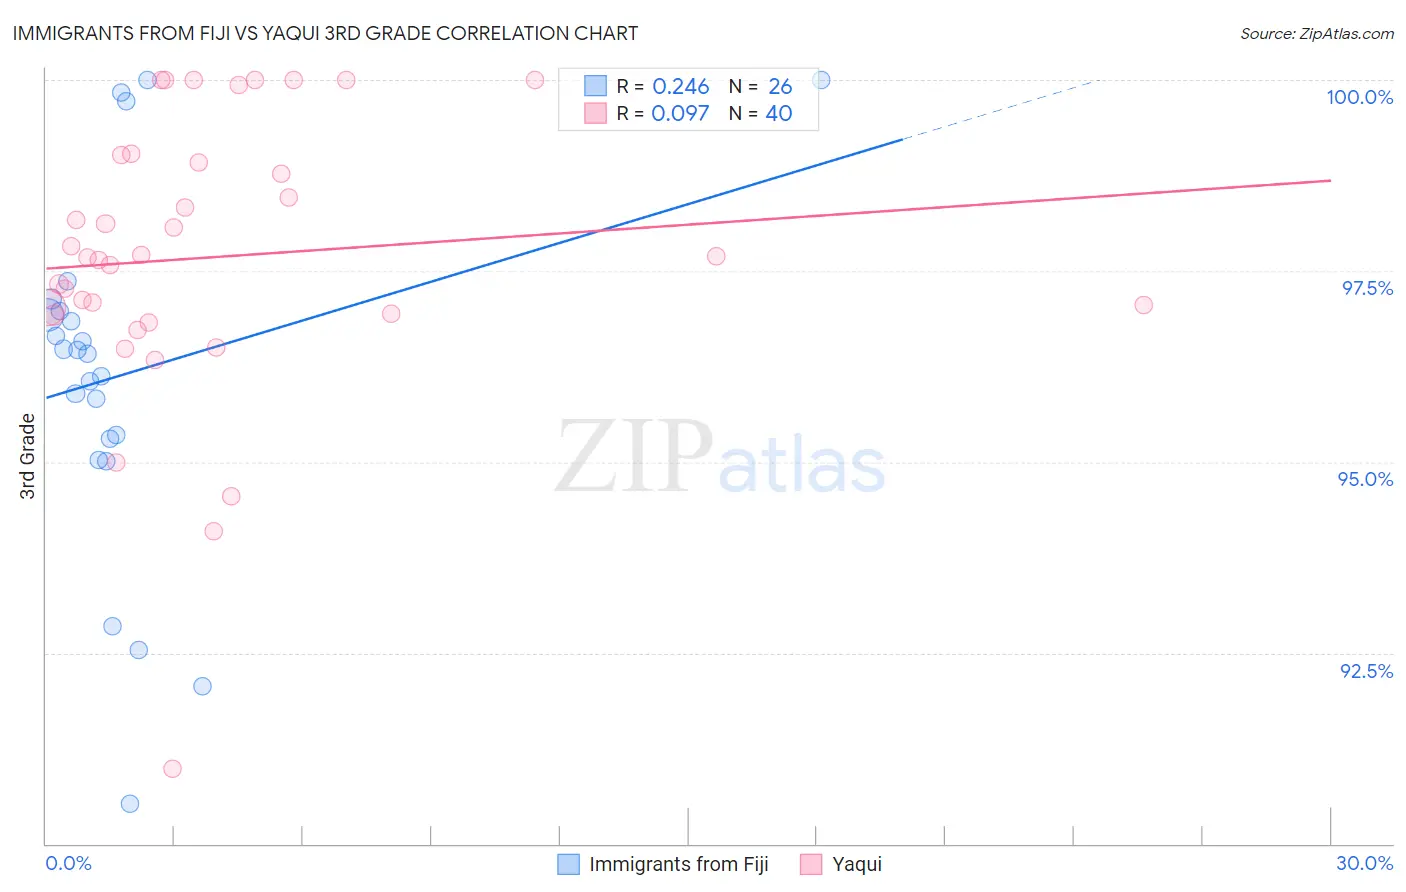
Immigrants from Fiji vs Yaqui 3rd Grade Correlation Chart
The statistical analysis conducted on geographies consisting of 93,756,204 people shows a weak positive correlation between the proportion of Immigrants from Fiji and percentage of population with at least 3rd grade education in the United States with a correlation coefficient (R) of 0.246 and weighted average of 96.2%. Similarly, the statistical analysis conducted on geographies consisting of 107,732,380 people shows a slight positive correlation between the proportion of Yaqui and percentage of population with at least 3rd grade education in the United States with a correlation coefficient (R) of 0.097 and weighted average of 97.3%, a difference of 1.1%.
3rd Grade Correlation Summary
| Measurement | Immigrants from Fiji | Yaqui |
| Minimum | 90.5% | 91.0% |
| Maximum | 100.0% | 100.0% |
| Range | 9.5% | 9.0% |
| Mean | 96.2% | 97.7% |
| Median | 96.4% | 97.7% |
| Interquartile 25% (IQ1) | 95.3% | 96.9% |
| Interquartile 75% (IQ3) | 97.0% | 99.0% |
| Interquartile Range (IQR) | 1.7% | 2.0% |
| Standard Deviation (Sample) | 2.3% | 1.9% |
| Standard Deviation (Population) | 2.3% | 1.8% |
Similar Demographics by 3rd Grade
Demographics Similar to Immigrants from Fiji by 3rd Grade
In terms of 3rd grade, the demographic groups most similar to Immigrants from Fiji are Immigrants from Cambodia (96.2%, a difference of 0.020%), Immigrants from Dominican Republic (96.2%, a difference of 0.020%), Mexican (96.2%, a difference of 0.030%), Immigrants from Latin America (96.2%, a difference of 0.040%), and Immigrants from Cabo Verde (96.2%, a difference of 0.040%).
| Demographics | Rating | Rank | 3rd Grade |
| Immigrants | Vietnam | 0.0 /100 | #326 | Tragic 96.4% |
| Japanese | 0.0 /100 | #327 | Tragic 96.4% |
| Bangladeshis | 0.0 /100 | #328 | Tragic 96.3% |
| Immigrants | Honduras | 0.0 /100 | #329 | Tragic 96.3% |
| Immigrants | Armenia | 0.0 /100 | #330 | Tragic 96.3% |
| Immigrants | Latin America | 0.0 /100 | #331 | Tragic 96.2% |
| Mexicans | 0.0 /100 | #332 | Tragic 96.2% |
| Immigrants | Fiji | 0.0 /100 | #333 | Tragic 96.2% |
| Immigrants | Cambodia | 0.0 /100 | #334 | Tragic 96.2% |
| Immigrants | Dominican Republic | 0.0 /100 | #335 | Tragic 96.2% |
| Immigrants | Cabo Verde | 0.0 /100 | #336 | Tragic 96.2% |
| Central Americans | 0.0 /100 | #337 | Tragic 96.1% |
| Guatemalans | 0.0 /100 | #338 | Tragic 96.0% |
| Yakama | 0.0 /100 | #339 | Tragic 95.9% |
| Nepalese | 0.0 /100 | #340 | Tragic 95.9% |
Demographics Similar to Yaqui by 3rd Grade
In terms of 3rd grade, the demographic groups most similar to Yaqui are Immigrants from Nigeria (97.3%, a difference of 0.0%), Immigrants from Jamaica (97.3%, a difference of 0.010%), Cuban (97.3%, a difference of 0.010%), Fijian (97.3%, a difference of 0.010%), and Taiwanese (97.3%, a difference of 0.020%).
| Demographics | Rating | Rank | 3rd Grade |
| Armenians | 0.4 /100 | #259 | Tragic 97.3% |
| Immigrants | Ethiopia | 0.4 /100 | #260 | Tragic 97.3% |
| Immigrants | South America | 0.4 /100 | #261 | Tragic 97.3% |
| Immigrants | Sierra Leone | 0.4 /100 | #262 | Tragic 97.3% |
| Taiwanese | 0.3 /100 | #263 | Tragic 97.3% |
| West Indians | 0.3 /100 | #264 | Tragic 97.3% |
| Immigrants | Jamaica | 0.3 /100 | #265 | Tragic 97.3% |
| Yaqui | 0.3 /100 | #266 | Tragic 97.3% |
| Immigrants | Nigeria | 0.3 /100 | #267 | Tragic 97.3% |
| Cubans | 0.2 /100 | #268 | Tragic 97.3% |
| Fijians | 0.2 /100 | #269 | Tragic 97.3% |
| Immigrants | China | 0.2 /100 | #270 | Tragic 97.2% |
| Puerto Ricans | 0.2 /100 | #271 | Tragic 97.2% |
| Ghanaians | 0.1 /100 | #272 | Tragic 97.2% |
| Immigrants | Peru | 0.1 /100 | #273 | Tragic 97.2% |