Colombian vs Yaqui Single Mother Poverty
COMPARE
Colombian
Yaqui
Single Mother Poverty
Single Mother Poverty Comparison
Colombians
Yaqui
28.3%
SINGLE MOTHER POVERTY
91.8/ 100
METRIC RATING
122nd/ 347
METRIC RANK
33.1%
SINGLE MOTHER POVERTY
0.0/ 100
METRIC RATING
295th/ 347
METRIC RANK
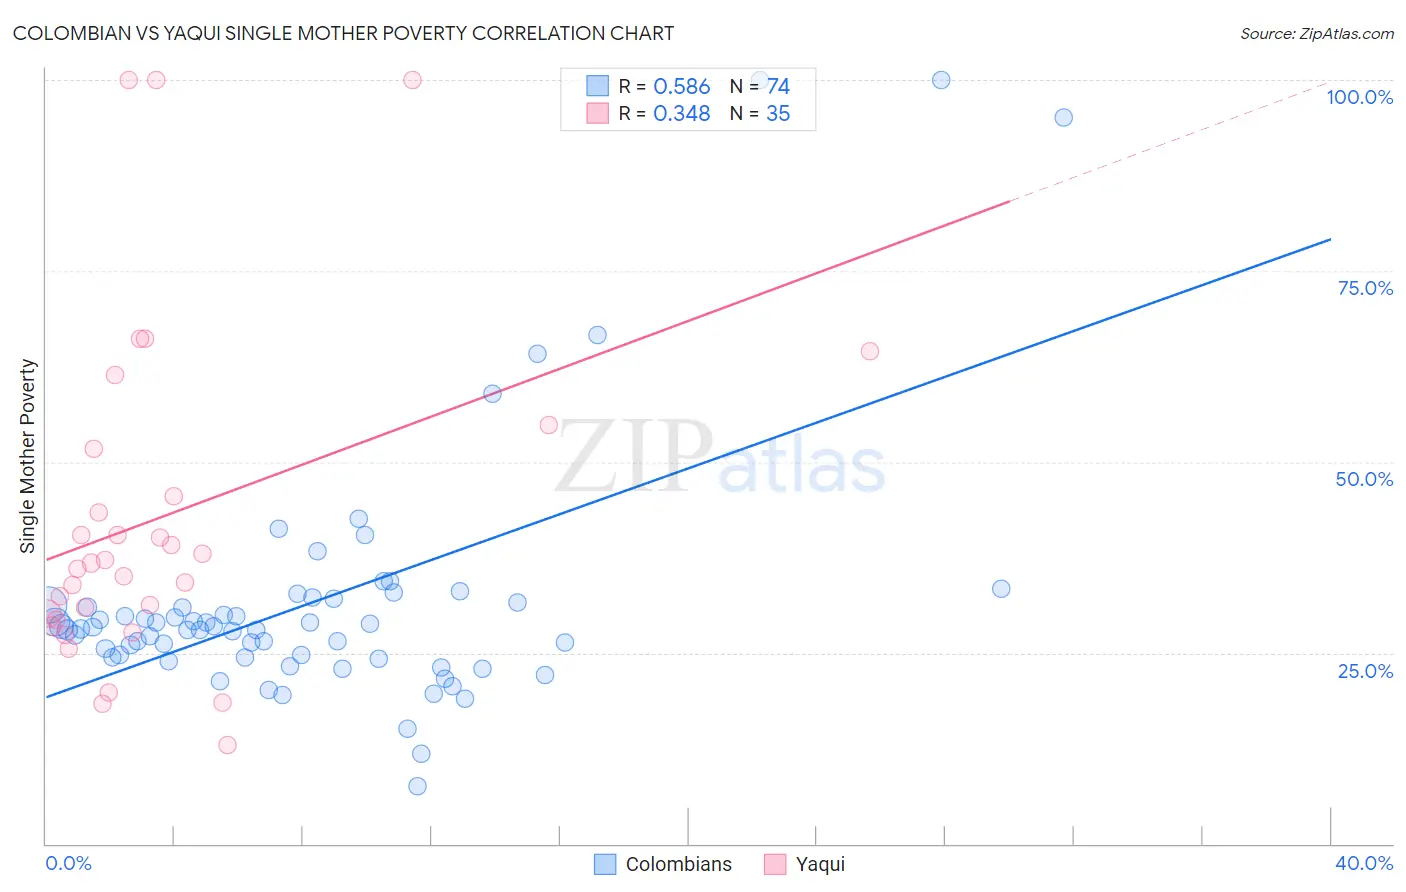
Colombian vs Yaqui Single Mother Poverty Correlation Chart
The statistical analysis conducted on geographies consisting of 409,096,293 people shows a substantial positive correlation between the proportion of Colombians and poverty level among single mothers in the United States with a correlation coefficient (R) of 0.586 and weighted average of 28.3%. Similarly, the statistical analysis conducted on geographies consisting of 106,870,477 people shows a mild positive correlation between the proportion of Yaqui and poverty level among single mothers in the United States with a correlation coefficient (R) of 0.348 and weighted average of 33.1%, a difference of 17.0%.
Single Mother Poverty Correlation Summary
| Measurement | Colombian | Yaqui |
| Minimum | 7.6% | 12.9% |
| Maximum | 100.0% | 100.0% |
| Range | 92.4% | 87.1% |
| Mean | 31.7% | 42.8% |
| Median | 28.2% | 36.7% |
| Interquartile 25% (IQ1) | 24.4% | 29.3% |
| Interquartile 75% (IQ3) | 31.6% | 51.8% |
| Interquartile Range (IQR) | 7.2% | 22.5% |
| Standard Deviation (Sample) | 16.6% | 22.1% |
| Standard Deviation (Population) | 16.5% | 21.8% |
Similar Demographics by Single Mother Poverty
Demographics Similar to Colombians by Single Mother Poverty
In terms of single mother poverty, the demographic groups most similar to Colombians are Uruguayan (28.3%, a difference of 0.010%), Immigrants from Switzerland (28.3%, a difference of 0.010%), Immigrants from Afghanistan (28.3%, a difference of 0.050%), Cypriot (28.3%, a difference of 0.090%), and Immigrants from Syria (28.3%, a difference of 0.10%).
| Demographics | Rating | Rank | Single Mother Poverty |
| Immigrants | Kuwait | 92.7 /100 | #115 | Exceptional 28.3% |
| Immigrants | Uganda | 92.5 /100 | #116 | Exceptional 28.3% |
| Australians | 92.5 /100 | #117 | Exceptional 28.3% |
| Brazilians | 92.4 /100 | #118 | Exceptional 28.3% |
| Immigrants | Syria | 92.4 /100 | #119 | Exceptional 28.3% |
| Cypriots | 92.3 /100 | #120 | Exceptional 28.3% |
| Immigrants | Afghanistan | 92.1 /100 | #121 | Exceptional 28.3% |
| Colombians | 91.8 /100 | #122 | Exceptional 28.3% |
| Uruguayans | 91.7 /100 | #123 | Exceptional 28.3% |
| Immigrants | Switzerland | 91.7 /100 | #124 | Exceptional 28.3% |
| Kenyans | 90.9 /100 | #125 | Exceptional 28.4% |
| Immigrants | Chile | 90.8 /100 | #126 | Exceptional 28.4% |
| Poles | 90.8 /100 | #127 | Exceptional 28.4% |
| Immigrants | England | 90.5 /100 | #128 | Exceptional 28.4% |
| South Americans | 90.4 /100 | #129 | Exceptional 28.4% |
Demographics Similar to Yaqui by Single Mother Poverty
In terms of single mother poverty, the demographic groups most similar to Yaqui are French American Indian (33.1%, a difference of 0.030%), Blackfeet (33.2%, a difference of 0.16%), Pennsylvania German (33.2%, a difference of 0.30%), African (33.3%, a difference of 0.41%), and Immigrants from Guatemala (33.3%, a difference of 0.50%).
| Demographics | Rating | Rank | Single Mother Poverty |
| Somalis | 0.0 /100 | #288 | Tragic 32.6% |
| U.S. Virgin Islanders | 0.0 /100 | #289 | Tragic 32.6% |
| Osage | 0.0 /100 | #290 | Tragic 32.6% |
| Guatemalans | 0.0 /100 | #291 | Tragic 32.9% |
| Shoshone | 0.0 /100 | #292 | Tragic 32.9% |
| Aleuts | 0.0 /100 | #293 | Tragic 32.9% |
| French American Indians | 0.0 /100 | #294 | Tragic 33.1% |
| Yaqui | 0.0 /100 | #295 | Tragic 33.1% |
| Blackfeet | 0.0 /100 | #296 | Tragic 33.2% |
| Pennsylvania Germans | 0.0 /100 | #297 | Tragic 33.2% |
| Africans | 0.0 /100 | #298 | Tragic 33.3% |
| Immigrants | Guatemala | 0.0 /100 | #299 | Tragic 33.3% |
| Hispanics or Latinos | 0.0 /100 | #300 | Tragic 33.3% |
| Immigrants | Somalia | 0.0 /100 | #301 | Tragic 33.4% |
| Arapaho | 0.0 /100 | #302 | Tragic 33.4% |