Alaskan Athabascan vs Yaqui Single Mother Poverty

COMPARE

Alaskan Athabascan
Race
Ancestry
AfghanAfricanAlaska NativeAlaskan AthabascanAlbanianAleutAlsatianAmericanApacheArabArapahoArgentineanArmenianAssyrian/Chaldean/SyriacAustralianAustrianBahamianBangladeshiBarbadianBasqueBelgianBelizeanBermudanBhutaneseBlackfeetBolivianBrazilianBritishBritish West IndianBulgarianBurmeseCajunCambodianCanadianCape VerdeanCarpatho RusynCelticCentral AmericanCentral American IndianCherokeeCheyenneChickasawChileanChineseChippewaChoctawColombianColvilleComancheCosta RicanCreeCreekCroatianCrowCubanCypriotCzechCzechoslovakianDanishDelawareDominicanDutchDutch West IndianEastern EuropeanEcuadorianEgyptianEnglishEstonianEthiopianEuropeanFijianFilipinoFinnishFrenchFrench American IndianFrench CanadianGermanGerman RussianGhanaianGreekGuamanian/ChamorroGuatemalanGuyaneseHaitianHmongHonduranHopiHoumaHungarianIcelanderIndian (Asian)IndonesianInupiatIranianIraqiIrishIroquoisIsraeliItalianJamaicanJapaneseJordanianKenyanKiowaKoreanLaotianLatvianLebaneseLiberianLithuanianLumbeeLuxembourgerMacedonianMalaysianMalteseMarshalleseMenomineeMexicanMexican American IndianMongolianMoroccanNative HawaiianNavajoNepaleseNew ZealanderNicaraguanNigerianNorthern EuropeanNorwegianOkinawanOsageOttawaPaiutePakistaniPalestinianPanamanianParaguayanPennsylvania GermanPeruvianPimaPolishPortuguesePotawatomiPuebloPuerto RicanPuget Sound SalishRomanianRussianSalvadoranSamoanScandinavianScotch-IrishScottishSeminoleSenegaleseSerbianShoshoneSierra LeoneanSiouxSlavicSlovakSloveneSomaliSouth AfricanSouth AmericanSouth American IndianSoviet UnionSpaniardSpanishSpanish AmericanSpanish American IndianSri LankanSubsaharan AfricanSudaneseSwedishSwissSyrianTaiwaneseThaiTlingit-HaidaTohono O'OdhamTonganTrinidadian and TobagonianTsimshianTurkishU.S. Virgin IslanderUgandanUkrainianUruguayanUteVenezuelanVietnameseWelshWest IndianYakamaYugoslavianYumanYup'ikZimbabwean
Immigration
NonimmigrantsImmigrantsAfghanistanAfricaAlbaniaArgentinaArmeniaAsiaAustraliaAustriaBahamasBangladeshBarbadosBelarusBelgiumBelizeBoliviaBosnia and HerzegovinaBrazilBulgariaBurma/MyanmarCabo VerdeCambodiaCameroonCanadaCaribbeanCentral AmericaChileChinaColombiaCongoCosta RicaCroatiaCubaCzechoslovakiaDenmarkDominicaDominican RepublicEastern AfricaEastern AsiaEastern EuropeEcuadorEgyptEl SalvadorEnglandEritreaEthiopiaEuropeFijiFranceGermanyGhanaGreeceGrenadaGuatemalaGuyanaHaitiHondurasHong KongHungaryIndiaIndonesiaIranIraqIrelandIsraelItalyJamaicaJapanJordanKazakhstanKenyaKoreaKuwaitLaosLatin AmericaLatviaLebanonLiberiaLithuaniaMalaysiaMexicoMicronesiaMiddle AfricaMoldovaMoroccoNepalNetherlandsNicaraguaNigeriaNorth AmericaNorth MacedoniaNorthern AfricaNorthern EuropeNorwayOceaniaPakistanPanamaPeruPhilippinesPolandPortugalRomaniaRussiaSaudi ArabiaScotlandSenegalSerbiaSierra LeoneSingaporeSomaliaSouth AfricaSouth AmericaSouth Central AsiaSouth Eastern AsiaSouthern EuropeSpainSri LankaSt. Vincent and the GrenadinesSudanSwedenSwitzerlandSyriaTaiwanThailandTrinidad and TobagoTurkeyUgandaUkraineUruguayUzbekistanVenezuelaVietnamWest IndiesWestern AfricaWestern AsiaWestern EuropeYemenZaireZimbabweAzores
Yaqui
Race
Ancestry
AfghanAfricanAlaska NativeAlbanianAleutAlsatianAmericanApacheArabArapahoArgentineanArmenianAssyrian/Chaldean/SyriacAustralianAustrianBahamianBangladeshiBarbadianBasqueBelgianBelizeanBermudanBhutaneseBlackfeetBolivianBrazilianBritishBritish West IndianBulgarianBurmeseCajunCambodianCanadianCape VerdeanCarpatho RusynCelticCentral AmericanCentral American IndianCherokeeCheyenneChickasawChileanChineseChippewaChoctawColombianColvilleComancheCosta RicanCreeCreekCroatianCrowCubanCypriotCzechCzechoslovakianDanishDelawareDominicanDutchDutch West IndianEastern EuropeanEcuadorianEgyptianEnglishEstonianEthiopianEuropeanFijianFilipinoFinnishFrenchFrench American IndianFrench CanadianGermanGerman RussianGhanaianGreekGuamanian/ChamorroGuatemalanGuyaneseHaitianHmongHonduranHopiHoumaHungarianIcelanderIndian (Asian)IndonesianInupiatIranianIraqiIrishIroquoisIsraeliItalianJamaicanJapaneseJordanianKenyanKiowaKoreanLaotianLatvianLebaneseLiberianLithuanianLumbeeLuxembourgerMacedonianMalaysianMalteseMarshalleseMenomineeMexicanMexican American IndianMongolianMoroccanNative HawaiianNavajoNepaleseNew ZealanderNicaraguanNigerianNorthern EuropeanNorwegianOkinawanOsageOttawaPaiutePakistaniPalestinianPanamanianParaguayanPennsylvania GermanPeruvianPimaPolishPortuguesePotawatomiPuebloPuerto RicanPuget Sound SalishRomanianRussianSalvadoranSamoanScandinavianScotch-IrishScottishSeminoleSenegaleseSerbianShoshoneSierra LeoneanSiouxSlavicSlovakSloveneSomaliSouth AfricanSouth AmericanSouth American IndianSoviet UnionSpaniardSpanishSpanish AmericanSpanish American IndianSri LankanSubsaharan AfricanSudaneseSwedishSwissSyrianTaiwaneseThaiTlingit-HaidaTohono O'OdhamTonganTrinidadian and TobagonianTsimshianTurkishU.S. Virgin IslanderUgandanUkrainianUruguayanUteVenezuelanVietnameseWelshWest IndianYakamaYaquiYugoslavianYumanYup'ikZimbabwean
Immigration
NonimmigrantsImmigrantsAfghanistanAfricaAlbaniaArgentinaArmeniaAsiaAustraliaAustriaBahamasBangladeshBarbadosBelarusBelgiumBelizeBoliviaBosnia and HerzegovinaBrazilBulgariaBurma/MyanmarCabo VerdeCambodiaCameroonCanadaCaribbeanCentral AmericaChileChinaColombiaCongoCosta RicaCroatiaCubaCzechoslovakiaDenmarkDominicaDominican RepublicEastern AfricaEastern AsiaEastern EuropeEcuadorEgyptEl SalvadorEnglandEritreaEthiopiaEuropeFijiFranceGermanyGhanaGreeceGrenadaGuatemalaGuyanaHaitiHondurasHong KongHungaryIndiaIndonesiaIranIraqIrelandIsraelItalyJamaicaJapanJordanKazakhstanKenyaKoreaKuwaitLaosLatin AmericaLatviaLebanonLiberiaLithuaniaMalaysiaMexicoMicronesiaMiddle AfricaMoldovaMoroccoNepalNetherlandsNicaraguaNigeriaNorth AmericaNorth MacedoniaNorthern AfricaNorthern EuropeNorwayOceaniaPakistanPanamaPeruPhilippinesPolandPortugalRomaniaRussiaSaudi ArabiaScotlandSenegalSerbiaSierra LeoneSingaporeSomaliaSouth AfricaSouth AmericaSouth Central AsiaSouth Eastern AsiaSouthern EuropeSpainSri LankaSt. Vincent and the GrenadinesSudanSwedenSwitzerlandSyriaTaiwanThailandTrinidad and TobagoTurkeyUgandaUkraineUruguayUzbekistanVenezuelaVietnamWest IndiesWestern AfricaWestern AsiaWestern EuropeYemenZaireZimbabweAzores
Single Mother Poverty
Income
Poverty
Unemployment
Labor Participation
Family Structure
Vehicle Availability
Education Level
Disability

Single Mother Poverty Comparison

Alaskan Athabascans

Yaqui

Tragic
Tragic
30.3%
SINGLE MOTHER POVERTY
4.1/ 100
METRIC RATING
232nd/ 347
METRIC RANK
33.1%
SINGLE MOTHER POVERTY
0.0/ 100
METRIC RATING
295th/ 347
METRIC RANK

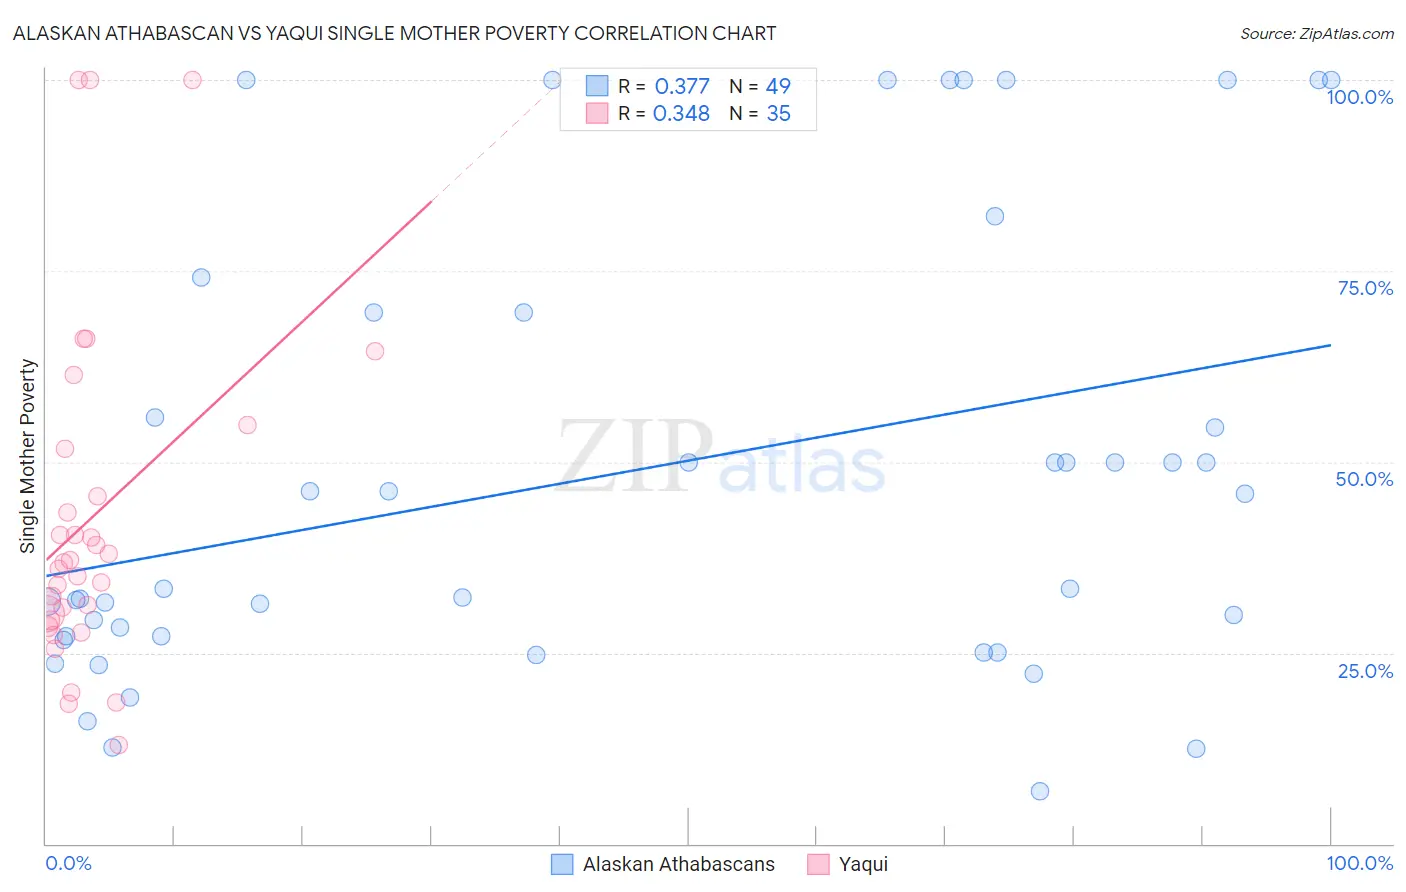
Alaskan Athabascan vs Yaqui Single Mother Poverty Correlation Chart

The statistical analysis conducted on geographies consisting of 45,529,547 people shows a mild positive correlation between the proportion of Alaskan Athabascans and poverty level among single mothers in the United States with a correlation coefficient (R) of 0.377 and weighted average of 30.3%. Similarly, the statistical analysis conducted on geographies consisting of 106,870,477 people shows a mild positive correlation between the proportion of Yaqui and poverty level among single mothers in the United States with a correlation coefficient (R) of 0.348 and weighted average of 33.1%, a difference of 9.5%.
Alaskan Athabascan vs Yaqui Single Mother Poverty

Single Mother Poverty Correlation Summary

MeasurementAlaskan AthabascanYaqui
Minimum6.8%12.9%
Maximum100.0%100.0%
Range93.2%87.1%
Mean48.6%42.8%
Median33.3%36.7%
Interquartile 25% (IQ1)26.9%29.3%
Interquartile 75% (IQ3)69.6%51.8%
Interquartile Range (IQR)42.6%22.5%
Standard Deviation (Sample)29.3%22.1%
Standard Deviation (Population)29.0%21.8%

Similar Demographics by Single Mother Poverty

Demographics Similar to Alaskan Athabascans by Single Mother Poverty

In terms of single mother poverty, the demographic groups most similar to Alaskan Athabascans are Dutch (30.2%, a difference of 0.040%), English (30.2%, a difference of 0.19%), Immigrants from Middle Africa (30.3%, a difference of 0.21%), Immigrants from Nicaragua (30.3%, a difference of 0.22%), and Immigrants from Barbados (30.2%, a difference of 0.23%).
DemographicsRating | RankSingle Mother Poverty
Spanish
6.3
/100
|
#225
Tragic
30.1%
Scottish
6.0
/100
|
#226
Tragic
30.1%
Immigrants | Liberia
5.9
/100
|
#227
Tragic
30.1%
Spaniards
5.4
/100
|
#228
Tragic
30.2%
Immigrants | Barbados
5.0
/100
|
#229
Tragic
30.2%
English
4.8
/100
|
#230
Tragic
30.2%
Dutch
4.3
/100
|
#231
Tragic
30.2%
Alaskan Athabascans
4.1
/100
|
#232
Tragic
30.3%
Immigrants | Middle Africa
3.5
/100
|
#233
Tragic
30.3%
Immigrants | Nicaragua
3.5
/100
|
#234
Tragic
30.3%
Immigrants | Grenada
3.4
/100
|
#235
Tragic
30.3%
Welsh
3.2
/100
|
#236
Tragic
30.4%
Immigrants | St. Vincent and the Grenadines
3.1
/100
|
#237
Tragic
30.4%
Slovaks
2.8
/100
|
#238
Tragic
30.4%
Immigrants | Portugal
2.1
/100
|
#239
Tragic
30.5%

Demographics Similar to Yaqui by Single Mother Poverty

In terms of single mother poverty, the demographic groups most similar to Yaqui are French American Indian (33.1%, a difference of 0.030%), Blackfeet (33.2%, a difference of 0.16%), Pennsylvania German (33.2%, a difference of 0.30%), African (33.3%, a difference of 0.41%), and Immigrants from Guatemala (33.3%, a difference of 0.50%).
DemographicsRating | RankSingle Mother Poverty
Somalis
0.0
/100
|
#288
Tragic
32.6%
U.S. Virgin Islanders
0.0
/100
|
#289
Tragic
32.6%
Osage
0.0
/100
|
#290
Tragic
32.6%
Guatemalans
0.0
/100
|
#291
Tragic
32.9%
Shoshone
0.0
/100
|
#292
Tragic
32.9%
Aleuts
0.0
/100
|
#293
Tragic
32.9%
French American Indians
0.0
/100
|
#294
Tragic
33.1%
Yaqui
0.0
/100
|
#295
Tragic
33.1%
Blackfeet
0.0
/100
|
#296
Tragic
33.2%
Pennsylvania Germans
0.0
/100
|
#297
Tragic
33.2%
Africans
0.0
/100
|
#298
Tragic
33.3%
Immigrants | Guatemala
0.0
/100
|
#299
Tragic
33.3%
Hispanics or Latinos
0.0
/100
|
#300
Tragic
33.3%
Immigrants | Somalia
0.0
/100
|
#301
Tragic
33.4%
Arapaho
0.0
/100
|
#302
Tragic
33.4%