Immigrants from Europe vs Nonimmigrants 1st Grade
COMPARE
Immigrants from Europe
Nonimmigrants
1st Grade
1st Grade Comparison
Immigrants from Europe
Nonimmigrants
98.1%
1ST GRADE
90.5/ 100
METRIC RATING
133rd/ 347
METRIC RANK
98.2%
1ST GRADE
98.3/ 100
METRIC RATING
97th/ 347
METRIC RANK
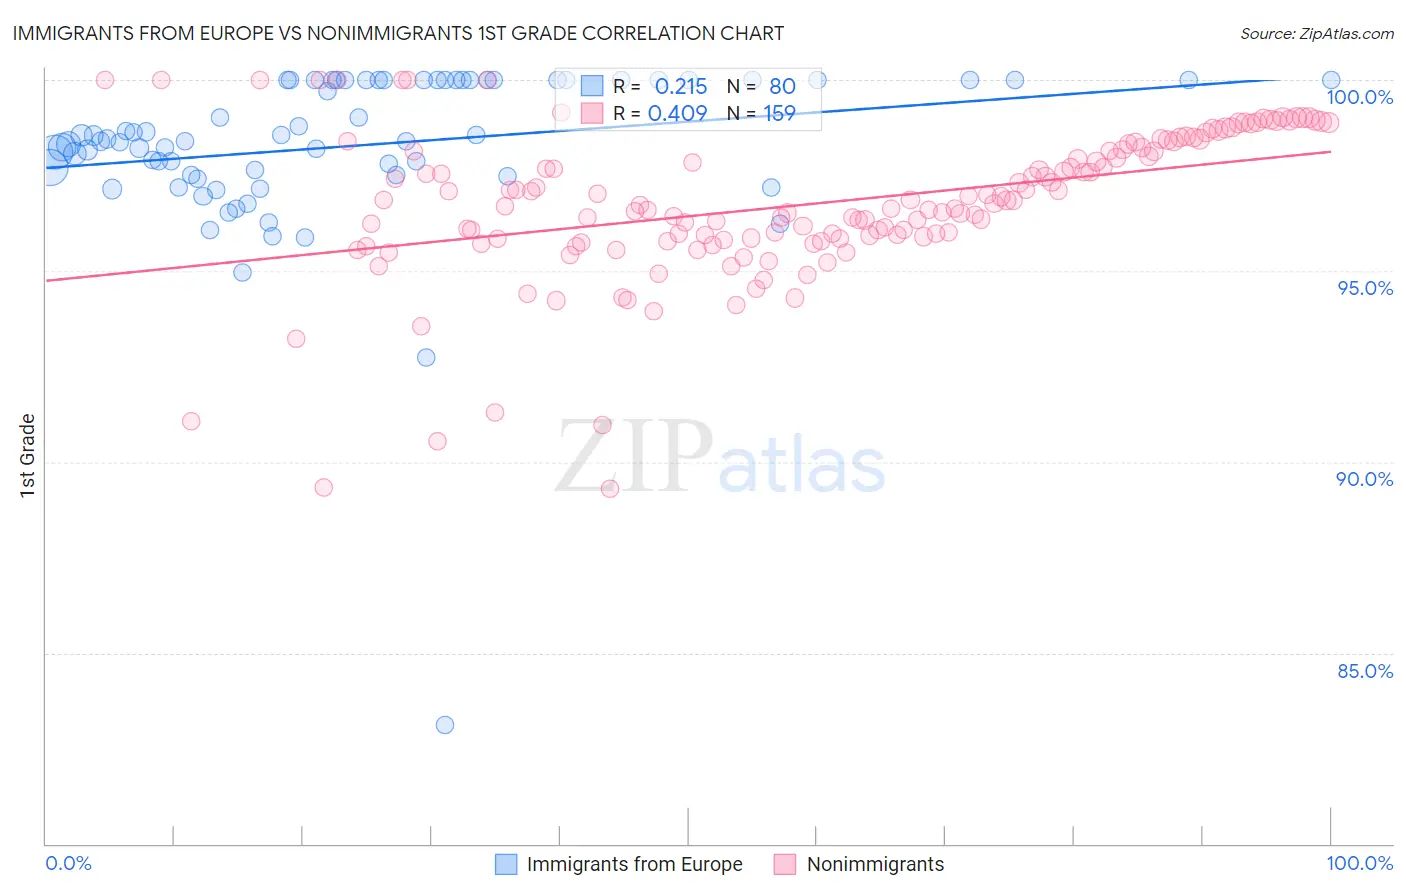
Immigrants from Europe vs Nonimmigrants 1st Grade Correlation Chart
The statistical analysis conducted on geographies consisting of 547,425,973 people shows a weak positive correlation between the proportion of Immigrants from Europe and percentage of population with at least 1st grade education in the United States with a correlation coefficient (R) of 0.215 and weighted average of 98.1%. Similarly, the statistical analysis conducted on geographies consisting of 585,374,774 people shows a moderate positive correlation between the proportion of Nonimmigrants and percentage of population with at least 1st grade education in the United States with a correlation coefficient (R) of 0.409 and weighted average of 98.2%, a difference of 0.14%.
1st Grade Correlation Summary
| Measurement | Immigrants from Europe | Nonimmigrants |
| Minimum | 83.1% | 89.3% |
| Maximum | 100.0% | 100.0% |
| Range | 16.9% | 10.7% |
| Mean | 98.3% | 96.8% |
| Median | 98.4% | 96.8% |
| Interquartile 25% (IQ1) | 97.5% | 95.9% |
| Interquartile 75% (IQ3) | 100.0% | 98.2% |
| Interquartile Range (IQR) | 2.5% | 2.4% |
| Standard Deviation (Sample) | 2.3% | 2.0% |
| Standard Deviation (Population) | 2.2% | 2.0% |
Similar Demographics by 1st Grade
Demographics Similar to Immigrants from Europe by 1st Grade
In terms of 1st grade, the demographic groups most similar to Immigrants from Europe are Cambodian (98.1%, a difference of 0.0%), Seminole (98.1%, a difference of 0.010%), Immigrants from Croatia (98.1%, a difference of 0.010%), Spaniard (98.1%, a difference of 0.010%), and Immigrants from Hungary (98.1%, a difference of 0.010%).
| Demographics | Rating | Rank | 1st Grade |
| Lebanese | 93.5 /100 | #126 | Exceptional 98.1% |
| Immigrants | Saudi Arabia | 93.3 /100 | #127 | Exceptional 98.1% |
| Immigrants | Serbia | 92.2 /100 | #128 | Exceptional 98.1% |
| Seminole | 91.9 /100 | #129 | Exceptional 98.1% |
| Immigrants | Croatia | 91.4 /100 | #130 | Exceptional 98.1% |
| Spaniards | 91.2 /100 | #131 | Exceptional 98.1% |
| Cambodians | 90.9 /100 | #132 | Exceptional 98.1% |
| Immigrants | Europe | 90.5 /100 | #133 | Exceptional 98.1% |
| Immigrants | Hungary | 89.4 /100 | #134 | Excellent 98.1% |
| Immigrants | Kuwait | 89.3 /100 | #135 | Excellent 98.1% |
| Immigrants | Bulgaria | 88.8 /100 | #136 | Excellent 98.1% |
| Israelis | 87.8 /100 | #137 | Excellent 98.1% |
| Immigrants | Romania | 87.8 /100 | #138 | Excellent 98.1% |
| Blackfeet | 87.6 /100 | #139 | Excellent 98.1% |
| Palestinians | 83.0 /100 | #140 | Excellent 98.0% |
Demographics Similar to Nonimmigrants by 1st Grade
In terms of 1st grade, the demographic groups most similar to Nonimmigrants are Cypriot (98.2%, a difference of 0.0%), Choctaw (98.2%, a difference of 0.0%), Puget Sound Salish (98.2%, a difference of 0.0%), Immigrants from India (98.2%, a difference of 0.010%), and South African (98.2%, a difference of 0.010%).
| Demographics | Rating | Rank | 1st Grade |
| Ukrainians | 98.8 /100 | #90 | Exceptional 98.3% |
| Immigrants | Western Europe | 98.8 /100 | #91 | Exceptional 98.3% |
| Macedonians | 98.7 /100 | #92 | Exceptional 98.3% |
| Immigrants | India | 98.6 /100 | #93 | Exceptional 98.2% |
| South Africans | 98.6 /100 | #94 | Exceptional 98.2% |
| Immigrants | Germany | 98.5 /100 | #95 | Exceptional 98.2% |
| Cypriots | 98.3 /100 | #96 | Exceptional 98.2% |
| Immigrants | Nonimmigrants | 98.3 /100 | #97 | Exceptional 98.2% |
| Choctaw | 98.3 /100 | #98 | Exceptional 98.2% |
| Puget Sound Salish | 98.2 /100 | #99 | Exceptional 98.2% |
| Colville | 98.0 /100 | #100 | Exceptional 98.2% |
| Romanians | 97.8 /100 | #101 | Exceptional 98.2% |
| Cree | 97.8 /100 | #102 | Exceptional 98.2% |
| Immigrants | Ireland | 97.7 /100 | #103 | Exceptional 98.2% |
| Pima | 97.5 /100 | #104 | Exceptional 98.2% |