British West Indian vs Guamanian/Chamorro Female Poverty
COMPARE
British West Indian
Guamanian/Chamorro
Female Poverty
Female Poverty Comparison
British West Indians
Guamanians/Chamorros
17.0%
FEMALE POVERTY
0.0/ 100
METRIC RATING
313th/ 347
METRIC RANK
13.3%
FEMALE POVERTY
62.4/ 100
METRIC RATING
162nd/ 347
METRIC RANK
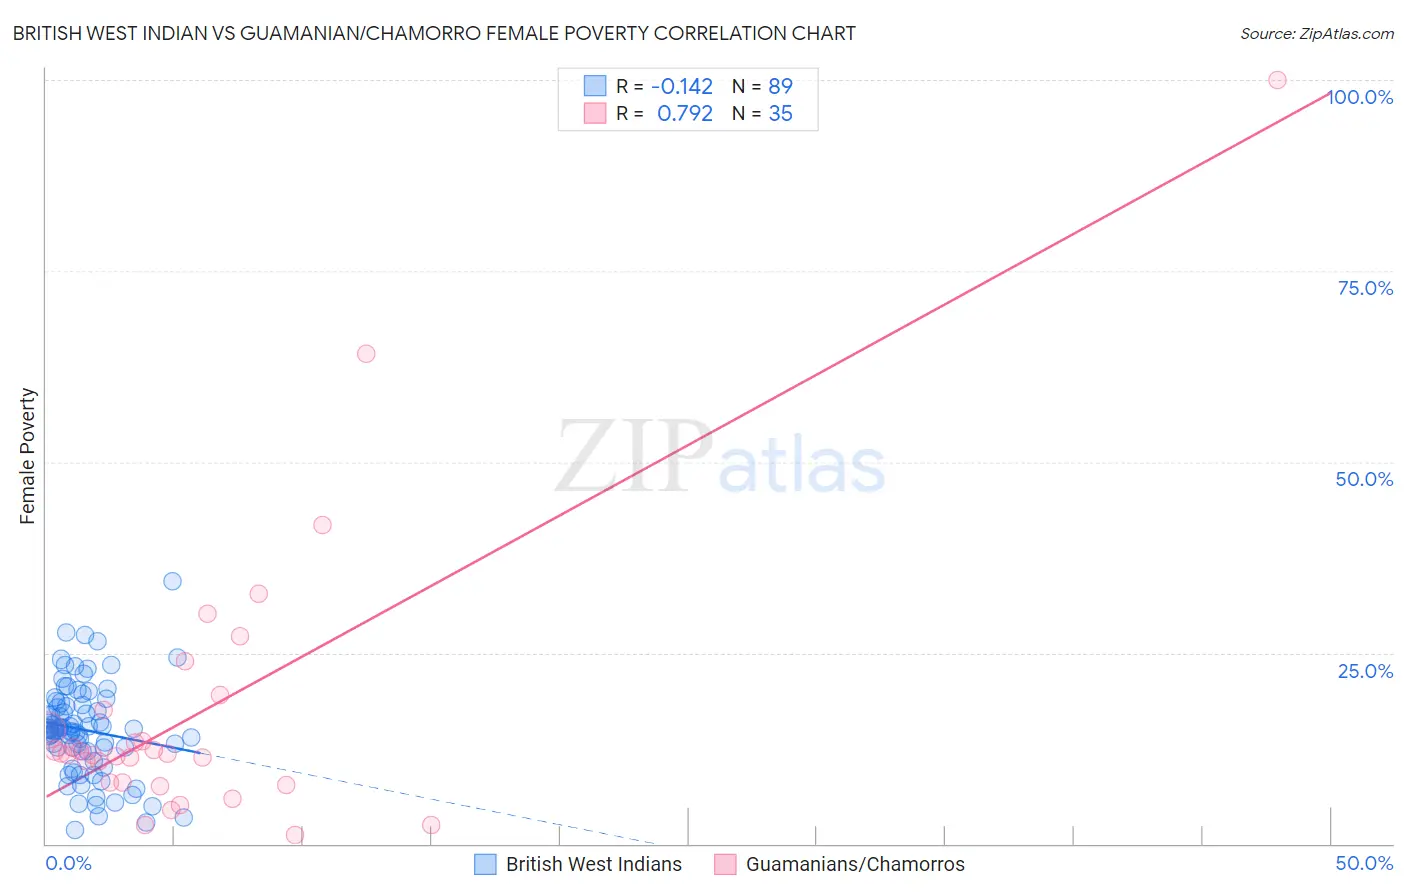
British West Indian vs Guamanian/Chamorro Female Poverty Correlation Chart
The statistical analysis conducted on geographies consisting of 152,611,621 people shows a poor negative correlation between the proportion of British West Indians and poverty level among females in the United States with a correlation coefficient (R) of -0.142 and weighted average of 17.0%. Similarly, the statistical analysis conducted on geographies consisting of 221,860,928 people shows a strong positive correlation between the proportion of Guamanians/Chamorros and poverty level among females in the United States with a correlation coefficient (R) of 0.792 and weighted average of 13.3%, a difference of 28.3%.
Female Poverty Correlation Summary
| Measurement | British West Indian | Guamanian/Chamorro |
| Minimum | 1.8% | 1.2% |
| Maximum | 34.4% | 100.0% |
| Range | 32.6% | 98.8% |
| Mean | 14.9% | 17.2% |
| Median | 15.0% | 11.7% |
| Interquartile 25% (IQ1) | 12.1% | 8.0% |
| Interquartile 75% (IQ3) | 18.3% | 17.6% |
| Interquartile Range (IQR) | 6.2% | 9.6% |
| Standard Deviation (Sample) | 6.1% | 18.9% |
| Standard Deviation (Population) | 6.0% | 18.6% |
Similar Demographics by Female Poverty
Demographics Similar to British West Indians by Female Poverty
In terms of female poverty, the demographic groups most similar to British West Indians are Immigrants from Somalia (17.0%, a difference of 0.080%), Creek (17.0%, a difference of 0.17%), Immigrants from Guatemala (17.0%, a difference of 0.17%), Dutch West Indian (17.1%, a difference of 0.25%), and Immigrants from Mexico (17.0%, a difference of 0.41%).
| Demographics | Rating | Rank | Female Poverty |
| Immigrants | Caribbean | 0.0 /100 | #306 | Tragic 16.9% |
| Seminole | 0.0 /100 | #307 | Tragic 16.9% |
| Africans | 0.0 /100 | #308 | Tragic 16.9% |
| Immigrants | Mexico | 0.0 /100 | #309 | Tragic 17.0% |
| Creek | 0.0 /100 | #310 | Tragic 17.0% |
| Immigrants | Guatemala | 0.0 /100 | #311 | Tragic 17.0% |
| Immigrants | Somalia | 0.0 /100 | #312 | Tragic 17.0% |
| British West Indians | 0.0 /100 | #313 | Tragic 17.0% |
| Dutch West Indians | 0.0 /100 | #314 | Tragic 17.1% |
| U.S. Virgin Islanders | 0.0 /100 | #315 | Tragic 17.3% |
| Hondurans | 0.0 /100 | #316 | Tragic 17.4% |
| Immigrants | Congo | 0.0 /100 | #317 | Tragic 17.4% |
| Ute | 0.0 /100 | #318 | Tragic 17.5% |
| Cajuns | 0.0 /100 | #319 | Tragic 17.5% |
| Immigrants | Dominica | 0.0 /100 | #320 | Tragic 17.5% |
Demographics Similar to Guamanians/Chamorros by Female Poverty
In terms of female poverty, the demographic groups most similar to Guamanians/Chamorros are Immigrants from Albania (13.3%, a difference of 0.0%), Immigrants from Ethiopia (13.3%, a difference of 0.010%), Ethiopian (13.3%, a difference of 0.010%), Immigrants from Nepal (13.3%, a difference of 0.030%), and Scotch-Irish (13.3%, a difference of 0.030%).
| Demographics | Rating | Rank | Female Poverty |
| Hungarians | 70.1 /100 | #155 | Good 13.2% |
| Immigrants | Bosnia and Herzegovina | 69.7 /100 | #156 | Good 13.2% |
| Immigrants | Northern Africa | 68.8 /100 | #157 | Good 13.2% |
| Pennsylvania Germans | 67.3 /100 | #158 | Good 13.2% |
| Costa Ricans | 63.6 /100 | #159 | Good 13.3% |
| Immigrants | Nepal | 62.7 /100 | #160 | Good 13.3% |
| Immigrants | Ethiopia | 62.5 /100 | #161 | Good 13.3% |
| Guamanians/Chamorros | 62.4 /100 | #162 | Good 13.3% |
| Immigrants | Albania | 62.4 /100 | #163 | Good 13.3% |
| Ethiopians | 62.3 /100 | #164 | Good 13.3% |
| Scotch-Irish | 62.1 /100 | #165 | Good 13.3% |
| Immigrants | Oceania | 59.7 /100 | #166 | Average 13.3% |
| Immigrants | Chile | 57.4 /100 | #167 | Average 13.3% |
| Aleuts | 56.7 /100 | #168 | Average 13.4% |
| Lebanese | 55.9 /100 | #169 | Average 13.4% |