Immigrants from Belgium vs Icelander Poverty
COMPARE
Immigrants from Belgium
Icelander
Poverty
Poverty Comparison
Immigrants from Belgium
Icelanders
11.3%
POVERTY
97.2/ 100
METRIC RATING
73rd/ 347
METRIC RANK
11.9%
POVERTY
77.9/ 100
METRIC RATING
144th/ 347
METRIC RANK
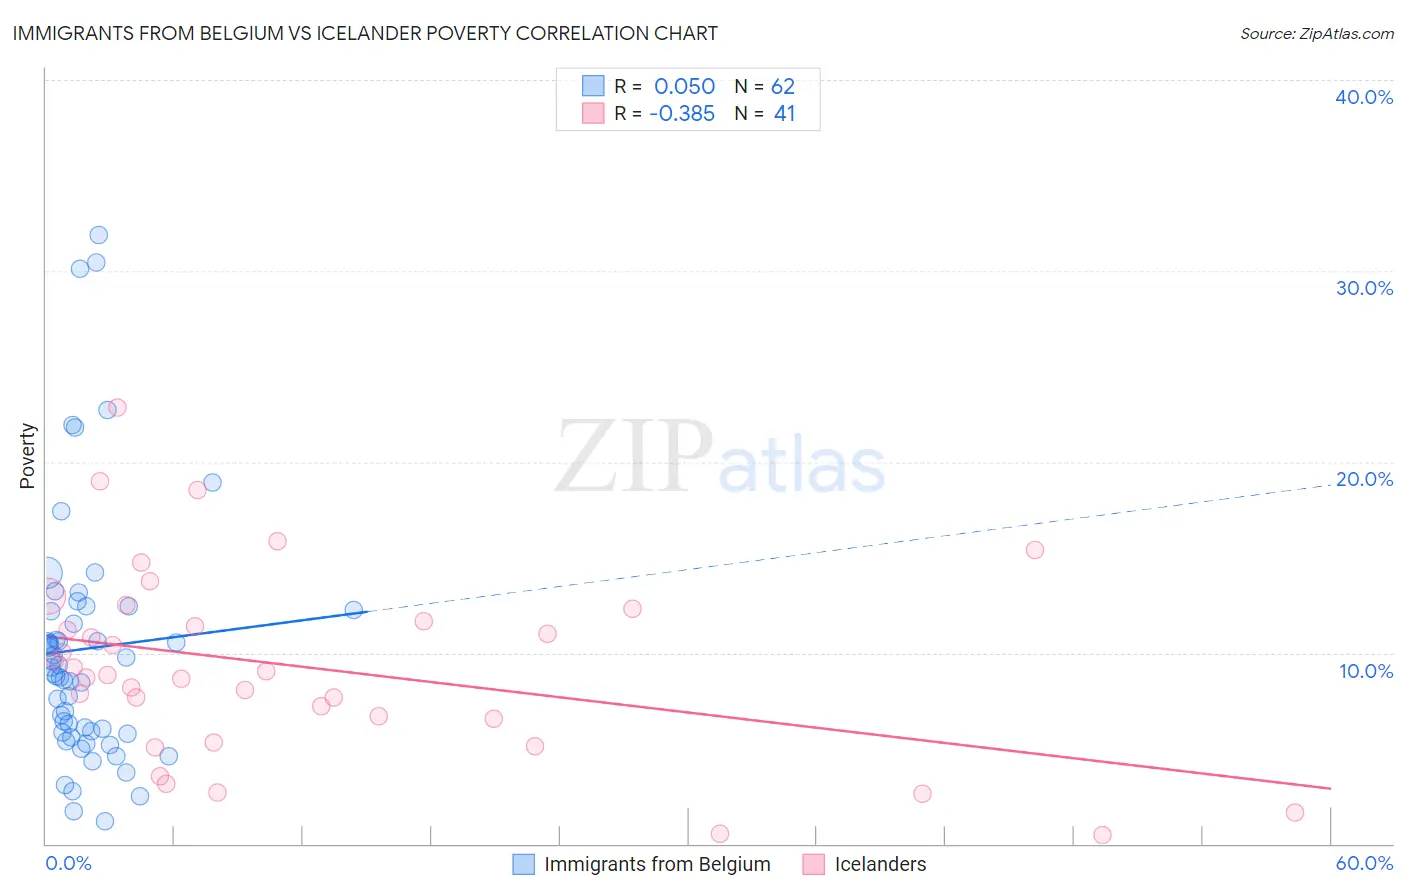
Immigrants from Belgium vs Icelander Poverty Correlation Chart
The statistical analysis conducted on geographies consisting of 146,699,020 people shows no correlation between the proportion of Immigrants from Belgium and poverty level in the United States with a correlation coefficient (R) of 0.050 and weighted average of 11.3%. Similarly, the statistical analysis conducted on geographies consisting of 159,621,690 people shows a mild negative correlation between the proportion of Icelanders and poverty level in the United States with a correlation coefficient (R) of -0.385 and weighted average of 11.9%, a difference of 6.1%.
Poverty Correlation Summary
| Measurement | Immigrants from Belgium | Icelander |
| Minimum | 1.2% | 0.44% |
| Maximum | 31.9% | 22.8% |
| Range | 30.7% | 22.4% |
| Mean | 10.2% | 9.2% |
| Median | 9.1% | 8.9% |
| Interquartile 25% (IQ1) | 5.8% | 5.9% |
| Interquartile 75% (IQ3) | 12.3% | 12.0% |
| Interquartile Range (IQR) | 6.4% | 6.0% |
| Standard Deviation (Sample) | 6.6% | 5.0% |
| Standard Deviation (Population) | 6.6% | 4.9% |
Similar Demographics by Poverty
Demographics Similar to Immigrants from Belgium by Poverty
In terms of poverty, the demographic groups most similar to Immigrants from Belgium are European (11.3%, a difference of 0.0%), Zimbabwean (11.3%, a difference of 0.020%), Immigrants from Canada (11.3%, a difference of 0.040%), Carpatho Rusyn (11.3%, a difference of 0.050%), and Serbian (11.2%, a difference of 0.13%).
| Demographics | Rating | Rank | Poverty |
| Immigrants | Netherlands | 97.5 /100 | #66 | Exceptional 11.2% |
| Immigrants | Australia | 97.4 /100 | #67 | Exceptional 11.2% |
| Slovaks | 97.4 /100 | #68 | Exceptional 11.2% |
| Serbians | 97.4 /100 | #69 | Exceptional 11.2% |
| Immigrants | Canada | 97.3 /100 | #70 | Exceptional 11.3% |
| Zimbabweans | 97.3 /100 | #71 | Exceptional 11.3% |
| Europeans | 97.2 /100 | #72 | Exceptional 11.3% |
| Immigrants | Belgium | 97.2 /100 | #73 | Exceptional 11.3% |
| Carpatho Rusyns | 97.2 /100 | #74 | Exceptional 11.3% |
| Immigrants | Eastern Europe | 97.0 /100 | #75 | Exceptional 11.3% |
| Immigrants | North America | 96.8 /100 | #76 | Exceptional 11.3% |
| Immigrants | Eastern Asia | 96.7 /100 | #77 | Exceptional 11.3% |
| Dutch | 96.7 /100 | #78 | Exceptional 11.3% |
| Cambodians | 96.7 /100 | #79 | Exceptional 11.3% |
| Indians (Asian) | 96.6 /100 | #80 | Exceptional 11.3% |
Demographics Similar to Icelanders by Poverty
In terms of poverty, the demographic groups most similar to Icelanders are Brazilian (11.9%, a difference of 0.27%), Basque (11.9%, a difference of 0.38%), Syrian (12.0%, a difference of 0.38%), Immigrants from France (11.9%, a difference of 0.40%), and Afghan (12.0%, a difference of 0.42%).
| Demographics | Rating | Rank | Poverty |
| Immigrants | Switzerland | 83.0 /100 | #137 | Excellent 11.8% |
| Immigrants | Jordan | 82.4 /100 | #138 | Excellent 11.9% |
| Pakistanis | 82.2 /100 | #139 | Excellent 11.9% |
| Immigrants | Peru | 81.1 /100 | #140 | Excellent 11.9% |
| Immigrants | France | 80.5 /100 | #141 | Excellent 11.9% |
| Basques | 80.4 /100 | #142 | Excellent 11.9% |
| Brazilians | 79.7 /100 | #143 | Good 11.9% |
| Icelanders | 77.9 /100 | #144 | Good 11.9% |
| Syrians | 75.1 /100 | #145 | Good 12.0% |
| Afghans | 74.9 /100 | #146 | Good 12.0% |
| Immigrants | Bosnia and Herzegovina | 73.7 /100 | #147 | Good 12.0% |
| Immigrants | Germany | 72.7 /100 | #148 | Good 12.0% |
| Immigrants | Malaysia | 72.7 /100 | #149 | Good 12.0% |
| Immigrants | Kazakhstan | 72.3 /100 | #150 | Good 12.0% |
| Samoans | 71.9 /100 | #151 | Good 12.0% |