Immigrants from El Salvador vs Immigrants from Sweden Female Poverty
COMPARE
Immigrants from El Salvador
Immigrants from Sweden
Female Poverty
Female Poverty Comparison
Immigrants from El Salvador
Immigrants from Sweden
15.7%
FEMALE POVERTY
0.1/ 100
METRIC RATING
266th/ 347
METRIC RANK
12.3%
FEMALE POVERTY
97.1/ 100
METRIC RATING
81st/ 347
METRIC RANK
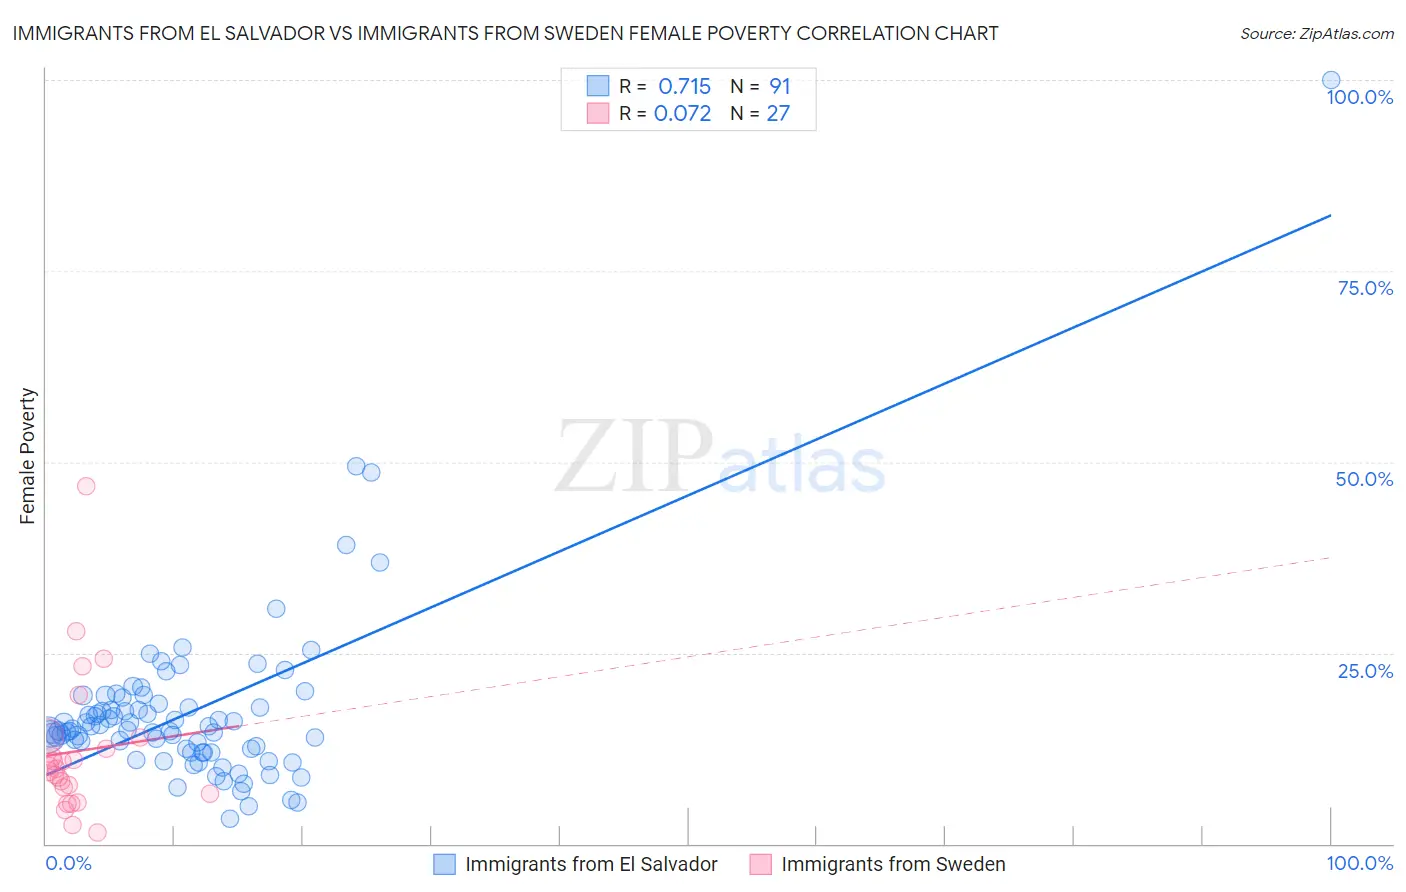
Immigrants from El Salvador vs Immigrants from Sweden Female Poverty Correlation Chart
The statistical analysis conducted on geographies consisting of 357,675,141 people shows a strong positive correlation between the proportion of Immigrants from El Salvador and poverty level among females in the United States with a correlation coefficient (R) of 0.715 and weighted average of 15.7%. Similarly, the statistical analysis conducted on geographies consisting of 164,683,428 people shows a slight positive correlation between the proportion of Immigrants from Sweden and poverty level among females in the United States with a correlation coefficient (R) of 0.072 and weighted average of 12.3%, a difference of 27.4%.
Female Poverty Correlation Summary
| Measurement | Immigrants from El Salvador | Immigrants from Sweden |
| Minimum | 3.3% | 1.5% |
| Maximum | 100.0% | 46.8% |
| Range | 96.7% | 45.4% |
| Mean | 17.2% | 12.1% |
| Median | 14.8% | 9.8% |
| Interquartile 25% (IQ1) | 12.0% | 6.5% |
| Interquartile 75% (IQ3) | 18.3% | 14.0% |
| Interquartile Range (IQR) | 6.3% | 7.5% |
| Standard Deviation (Sample) | 11.7% | 9.5% |
| Standard Deviation (Population) | 11.6% | 9.3% |
Similar Demographics by Female Poverty
Demographics Similar to Immigrants from El Salvador by Female Poverty
In terms of female poverty, the demographic groups most similar to Immigrants from El Salvador are Immigrants from Liberia (15.7%, a difference of 0.060%), Immigrants from Ecuador (15.6%, a difference of 0.36%), Subsaharan African (15.8%, a difference of 0.43%), Cherokee (15.6%, a difference of 0.49%), and Immigrants from Nicaragua (15.8%, a difference of 0.49%).
| Demographics | Rating | Rank | Female Poverty |
| Cape Verdeans | 0.1 /100 | #259 | Tragic 15.6% |
| Immigrants | Guyana | 0.1 /100 | #260 | Tragic 15.6% |
| Guyanese | 0.1 /100 | #261 | Tragic 15.6% |
| Mexican American Indians | 0.1 /100 | #262 | Tragic 15.6% |
| Cherokee | 0.1 /100 | #263 | Tragic 15.6% |
| Immigrants | Ecuador | 0.1 /100 | #264 | Tragic 15.6% |
| Immigrants | Liberia | 0.1 /100 | #265 | Tragic 15.7% |
| Immigrants | El Salvador | 0.1 /100 | #266 | Tragic 15.7% |
| Sub-Saharan Africans | 0.1 /100 | #267 | Tragic 15.8% |
| Immigrants | Nicaragua | 0.1 /100 | #268 | Tragic 15.8% |
| Iroquois | 0.1 /100 | #269 | Tragic 15.8% |
| Chickasaw | 0.1 /100 | #270 | Tragic 15.9% |
| Immigrants | St. Vincent and the Grenadines | 0.0 /100 | #271 | Tragic 15.9% |
| Belizeans | 0.0 /100 | #272 | Tragic 15.9% |
| Haitians | 0.0 /100 | #273 | Tragic 15.9% |
Demographics Similar to Immigrants from Sweden by Female Poverty
In terms of female poverty, the demographic groups most similar to Immigrants from Sweden are Slovak (12.3%, a difference of 0.0%), Jordanian (12.3%, a difference of 0.010%), Immigrants from North America (12.3%, a difference of 0.050%), Egyptian (12.3%, a difference of 0.12%), and Serbian (12.3%, a difference of 0.13%).
| Demographics | Rating | Rank | Female Poverty |
| Immigrants | Canada | 97.5 /100 | #74 | Exceptional 12.3% |
| Europeans | 97.4 /100 | #75 | Exceptional 12.3% |
| Immigrants | Eastern Europe | 97.2 /100 | #76 | Exceptional 12.3% |
| Serbians | 97.2 /100 | #77 | Exceptional 12.3% |
| Egyptians | 97.2 /100 | #78 | Exceptional 12.3% |
| Immigrants | North America | 97.1 /100 | #79 | Exceptional 12.3% |
| Slovaks | 97.1 /100 | #80 | Exceptional 12.3% |
| Immigrants | Sweden | 97.1 /100 | #81 | Exceptional 12.3% |
| Jordanians | 97.1 /100 | #82 | Exceptional 12.3% |
| Immigrants | England | 96.9 /100 | #83 | Exceptional 12.3% |
| Northern Europeans | 96.6 /100 | #84 | Exceptional 12.4% |
| Irish | 96.5 /100 | #85 | Exceptional 12.4% |
| Dutch | 96.5 /100 | #86 | Exceptional 12.4% |
| Okinawans | 96.4 /100 | #87 | Exceptional 12.4% |
| Finns | 96.4 /100 | #88 | Exceptional 12.4% |