Immigrants from Egypt vs Armenian Poverty
COMPARE
Immigrants from Egypt
Armenian
Poverty
Poverty Comparison
Immigrants from Egypt
Armenians
11.5%
POVERTY
94.6/ 100
METRIC RATING
97th/ 347
METRIC RANK
12.1%
POVERTY
67.6/ 100
METRIC RATING
152nd/ 347
METRIC RANK
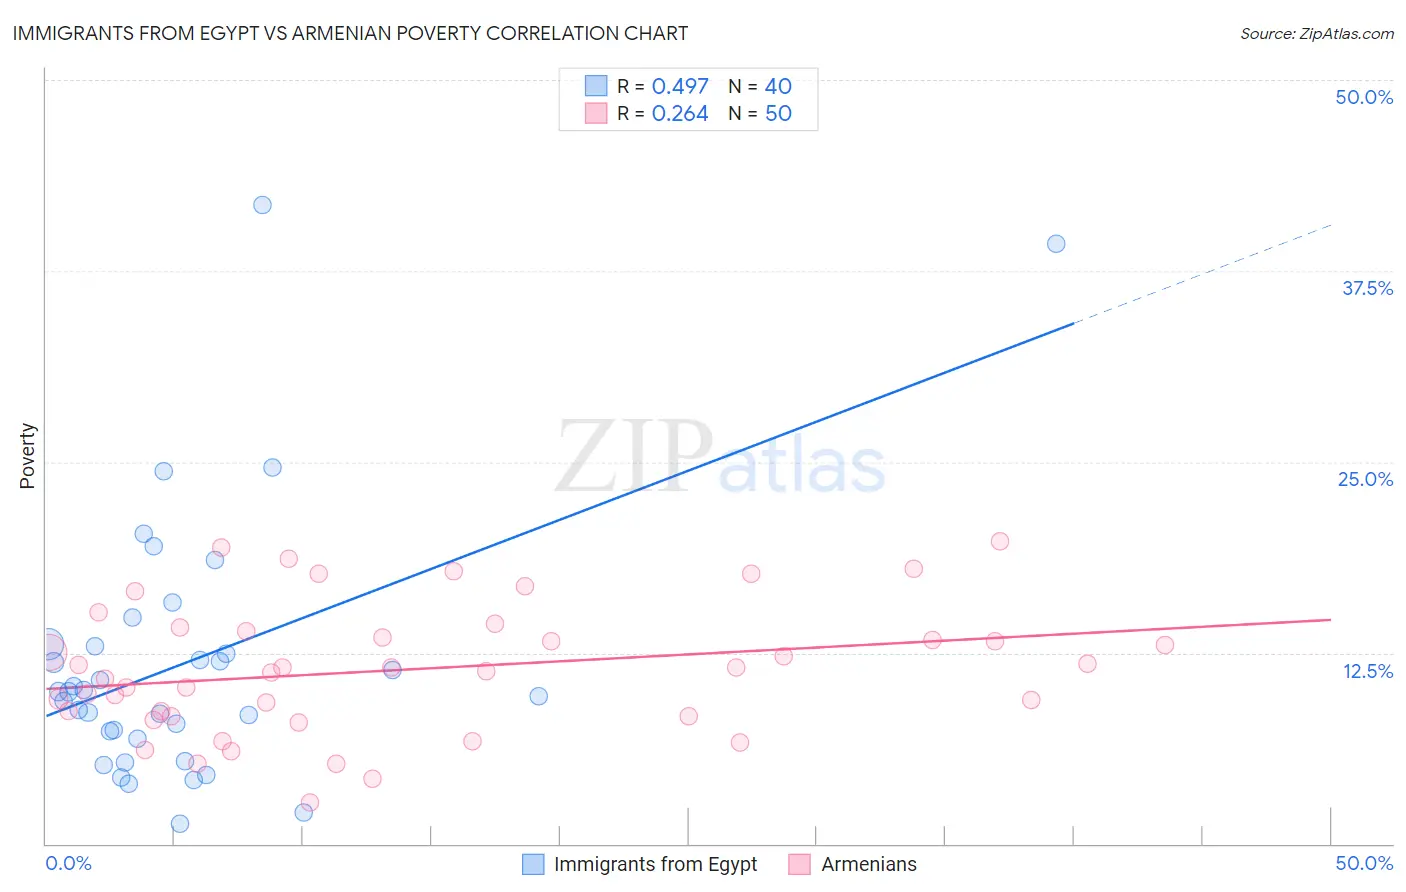
Immigrants from Egypt vs Armenian Poverty Correlation Chart
The statistical analysis conducted on geographies consisting of 245,409,377 people shows a moderate positive correlation between the proportion of Immigrants from Egypt and poverty level in the United States with a correlation coefficient (R) of 0.497 and weighted average of 11.5%. Similarly, the statistical analysis conducted on geographies consisting of 310,820,657 people shows a weak positive correlation between the proportion of Armenians and poverty level in the United States with a correlation coefficient (R) of 0.264 and weighted average of 12.1%, a difference of 5.5%.
Poverty Correlation Summary
| Measurement | Immigrants from Egypt | Armenian |
| Minimum | 1.3% | 2.7% |
| Maximum | 41.8% | 19.8% |
| Range | 40.5% | 17.1% |
| Mean | 11.9% | 11.4% |
| Median | 9.9% | 11.4% |
| Interquartile 25% (IQ1) | 7.1% | 8.3% |
| Interquartile 75% (IQ3) | 13.0% | 13.9% |
| Interquartile Range (IQR) | 5.9% | 5.6% |
| Standard Deviation (Sample) | 8.6% | 4.2% |
| Standard Deviation (Population) | 8.5% | 4.2% |
Similar Demographics by Poverty
Demographics Similar to Immigrants from Egypt by Poverty
In terms of poverty, the demographic groups most similar to Immigrants from Egypt are Immigrants from South Africa (11.5%, a difference of 0.030%), Immigrants from Latvia (11.5%, a difference of 0.030%), Australian (11.4%, a difference of 0.15%), Paraguayan (11.4%, a difference of 0.16%), and Immigrants from Indonesia (11.5%, a difference of 0.17%).
| Demographics | Rating | Rank | Poverty |
| Immigrants | Denmark | 95.5 /100 | #90 | Exceptional 11.4% |
| Finns | 95.2 /100 | #91 | Exceptional 11.4% |
| British | 95.0 /100 | #92 | Exceptional 11.4% |
| Romanians | 94.9 /100 | #93 | Exceptional 11.4% |
| Paraguayans | 94.9 /100 | #94 | Exceptional 11.4% |
| Australians | 94.9 /100 | #95 | Exceptional 11.4% |
| Immigrants | South Africa | 94.7 /100 | #96 | Exceptional 11.5% |
| Immigrants | Egypt | 94.6 /100 | #97 | Exceptional 11.5% |
| Immigrants | Latvia | 94.5 /100 | #98 | Exceptional 11.5% |
| Immigrants | Indonesia | 94.2 /100 | #99 | Exceptional 11.5% |
| Scottish | 94.0 /100 | #100 | Exceptional 11.5% |
| Slavs | 93.3 /100 | #101 | Exceptional 11.5% |
| Laotians | 92.4 /100 | #102 | Exceptional 11.6% |
| Okinawans | 92.4 /100 | #103 | Exceptional 11.6% |
| Native Hawaiians | 92.1 /100 | #104 | Exceptional 11.6% |
Demographics Similar to Armenians by Poverty
In terms of poverty, the demographic groups most similar to Armenians are Immigrants from Northern Africa (12.1%, a difference of 0.41%), Guamanian/Chamorro (12.1%, a difference of 0.41%), Hungarian (12.2%, a difference of 0.44%), Samoan (12.0%, a difference of 0.50%), and Immigrants from Kazakhstan (12.0%, a difference of 0.55%).
| Demographics | Rating | Rank | Poverty |
| Syrians | 75.1 /100 | #145 | Good 12.0% |
| Afghans | 74.9 /100 | #146 | Good 12.0% |
| Immigrants | Bosnia and Herzegovina | 73.7 /100 | #147 | Good 12.0% |
| Immigrants | Germany | 72.7 /100 | #148 | Good 12.0% |
| Immigrants | Malaysia | 72.7 /100 | #149 | Good 12.0% |
| Immigrants | Kazakhstan | 72.3 /100 | #150 | Good 12.0% |
| Samoans | 71.9 /100 | #151 | Good 12.0% |
| Armenians | 67.6 /100 | #152 | Good 12.1% |
| Immigrants | Northern Africa | 63.9 /100 | #153 | Good 12.1% |
| Guamanians/Chamorros | 63.9 /100 | #154 | Good 12.1% |
| Hungarians | 63.6 /100 | #155 | Good 12.2% |
| Scotch-Irish | 62.6 /100 | #156 | Good 12.2% |
| Costa Ricans | 62.2 /100 | #157 | Good 12.2% |
| Taiwanese | 61.8 /100 | #158 | Good 12.2% |
| Pennsylvania Germans | 60.8 /100 | #159 | Good 12.2% |