Immigrants from Egypt vs Immigrants from Philippines Poverty
COMPARE
Immigrants from Egypt
Immigrants from Philippines
Poverty
Poverty Comparison
Immigrants from Egypt
Immigrants from Philippines
11.5%
POVERTY
94.6/ 100
METRIC RATING
97th/ 347
METRIC RANK
11.0%
POVERTY
98.7/ 100
METRIC RATING
52nd/ 347
METRIC RANK
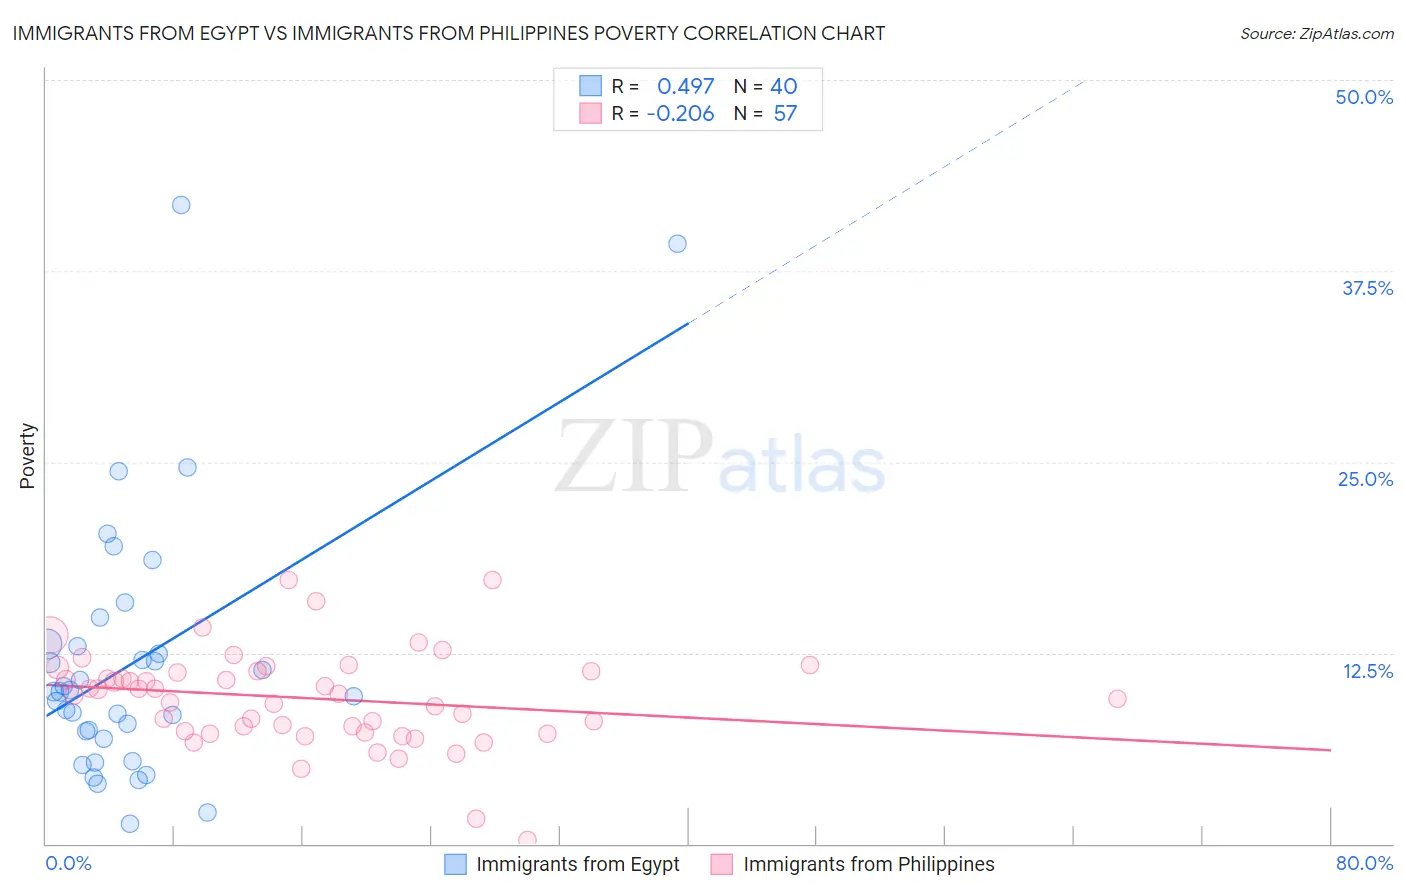
Immigrants from Egypt vs Immigrants from Philippines Poverty Correlation Chart
The statistical analysis conducted on geographies consisting of 245,409,377 people shows a moderate positive correlation between the proportion of Immigrants from Egypt and poverty level in the United States with a correlation coefficient (R) of 0.497 and weighted average of 11.5%. Similarly, the statistical analysis conducted on geographies consisting of 471,023,634 people shows a weak negative correlation between the proportion of Immigrants from Philippines and poverty level in the United States with a correlation coefficient (R) of -0.206 and weighted average of 11.0%, a difference of 3.9%.
Poverty Correlation Summary
| Measurement | Immigrants from Egypt | Immigrants from Philippines |
| Minimum | 1.3% | 0.27% |
| Maximum | 41.8% | 17.3% |
| Range | 40.5% | 17.0% |
| Mean | 11.9% | 9.5% |
| Median | 9.9% | 9.9% |
| Interquartile 25% (IQ1) | 7.1% | 7.3% |
| Interquartile 75% (IQ3) | 13.0% | 11.3% |
| Interquartile Range (IQR) | 5.9% | 4.0% |
| Standard Deviation (Sample) | 8.6% | 3.2% |
| Standard Deviation (Population) | 8.5% | 3.1% |
Similar Demographics by Poverty
Demographics Similar to Immigrants from Egypt by Poverty
In terms of poverty, the demographic groups most similar to Immigrants from Egypt are Immigrants from South Africa (11.5%, a difference of 0.030%), Immigrants from Latvia (11.5%, a difference of 0.030%), Australian (11.4%, a difference of 0.15%), Paraguayan (11.4%, a difference of 0.16%), and Immigrants from Indonesia (11.5%, a difference of 0.17%).
| Demographics | Rating | Rank | Poverty |
| Immigrants | Denmark | 95.5 /100 | #90 | Exceptional 11.4% |
| Finns | 95.2 /100 | #91 | Exceptional 11.4% |
| British | 95.0 /100 | #92 | Exceptional 11.4% |
| Romanians | 94.9 /100 | #93 | Exceptional 11.4% |
| Paraguayans | 94.9 /100 | #94 | Exceptional 11.4% |
| Australians | 94.9 /100 | #95 | Exceptional 11.4% |
| Immigrants | South Africa | 94.7 /100 | #96 | Exceptional 11.5% |
| Immigrants | Egypt | 94.6 /100 | #97 | Exceptional 11.5% |
| Immigrants | Latvia | 94.5 /100 | #98 | Exceptional 11.5% |
| Immigrants | Indonesia | 94.2 /100 | #99 | Exceptional 11.5% |
| Scottish | 94.0 /100 | #100 | Exceptional 11.5% |
| Slavs | 93.3 /100 | #101 | Exceptional 11.5% |
| Laotians | 92.4 /100 | #102 | Exceptional 11.6% |
| Okinawans | 92.4 /100 | #103 | Exceptional 11.6% |
| Native Hawaiians | 92.1 /100 | #104 | Exceptional 11.6% |
Demographics Similar to Immigrants from Philippines by Poverty
In terms of poverty, the demographic groups most similar to Immigrants from Philippines are Immigrants from Croatia (11.0%, a difference of 0.020%), Immigrants from Austria (11.1%, a difference of 0.23%), Immigrants from Bulgaria (11.1%, a difference of 0.34%), Immigrants from Serbia (11.1%, a difference of 0.37%), and Asian (11.0%, a difference of 0.42%).
| Demographics | Rating | Rank | Poverty |
| Turks | 98.9 /100 | #45 | Exceptional 11.0% |
| Immigrants | Czechoslovakia | 98.9 /100 | #46 | Exceptional 11.0% |
| Immigrants | Romania | 98.9 /100 | #47 | Exceptional 11.0% |
| Slovenes | 98.9 /100 | #48 | Exceptional 11.0% |
| Immigrants | Japan | 98.9 /100 | #49 | Exceptional 11.0% |
| Asians | 98.9 /100 | #50 | Exceptional 11.0% |
| Immigrants | Croatia | 98.7 /100 | #51 | Exceptional 11.0% |
| Immigrants | Philippines | 98.7 /100 | #52 | Exceptional 11.0% |
| Immigrants | Austria | 98.6 /100 | #53 | Exceptional 11.1% |
| Immigrants | Bulgaria | 98.5 /100 | #54 | Exceptional 11.1% |
| Immigrants | Serbia | 98.5 /100 | #55 | Exceptional 11.1% |
| Estonians | 98.2 /100 | #56 | Exceptional 11.1% |
| Scandinavians | 98.2 /100 | #57 | Exceptional 11.1% |
| Germans | 98.1 /100 | #58 | Exceptional 11.1% |
| Immigrants | Europe | 98.0 /100 | #59 | Exceptional 11.2% |