Immigrants from Egypt vs Afghan Single Female Poverty
COMPARE
Immigrants from Egypt
Afghan
Single Female Poverty
Single Female Poverty Comparison
Immigrants from Egypt
Afghans
19.2%
SINGLE FEMALE POVERTY
99.6/ 100
METRIC RATING
67th/ 347
METRIC RANK
19.5%
SINGLE FEMALE POVERTY
99.0/ 100
METRIC RATING
88th/ 347
METRIC RANK
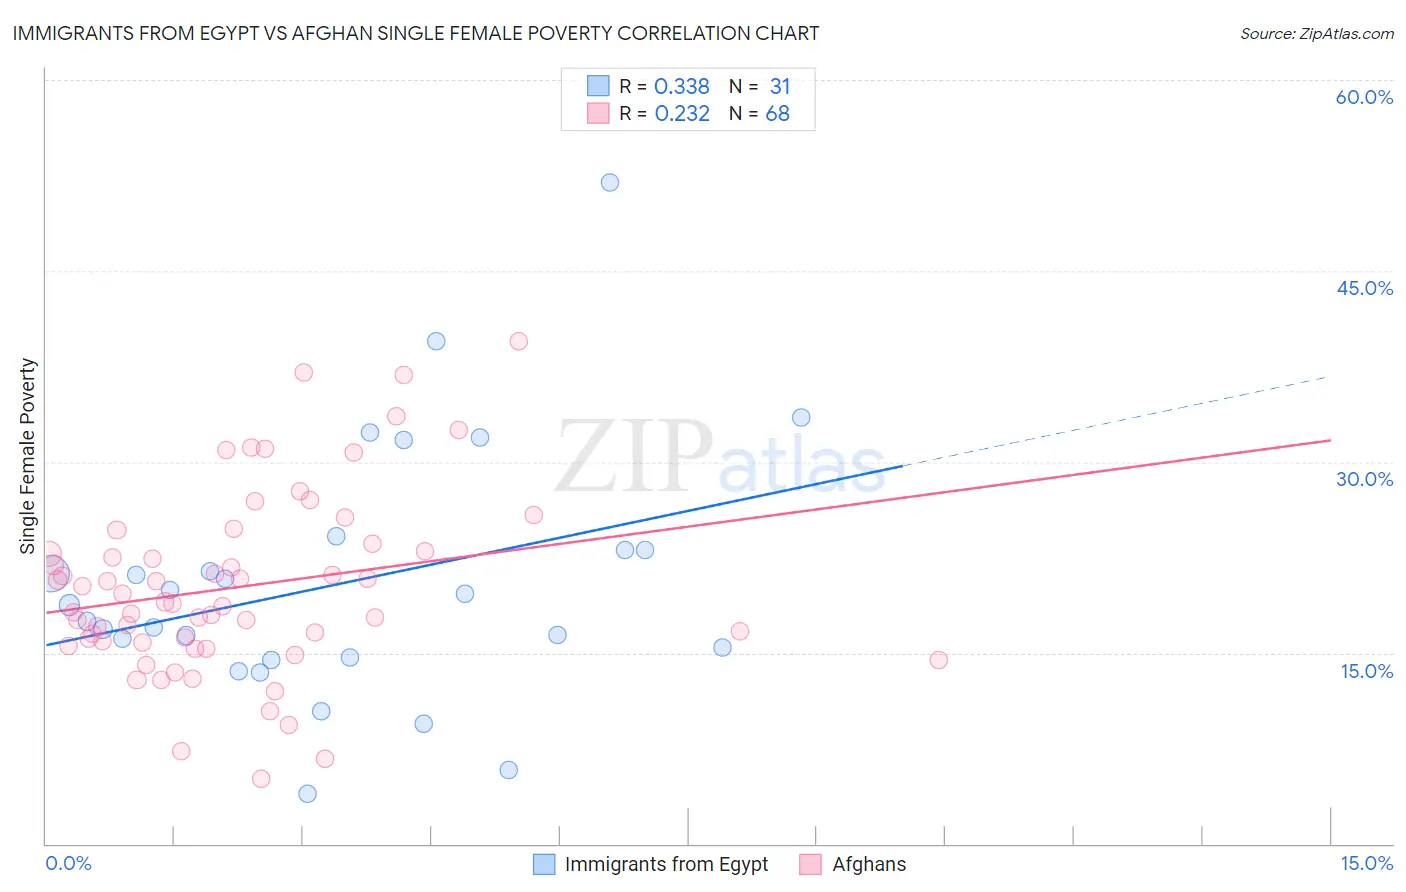
Immigrants from Egypt vs Afghan Single Female Poverty Correlation Chart
The statistical analysis conducted on geographies consisting of 243,038,717 people shows a mild positive correlation between the proportion of Immigrants from Egypt and poverty level among single females in the United States with a correlation coefficient (R) of 0.338 and weighted average of 19.2%. Similarly, the statistical analysis conducted on geographies consisting of 148,055,541 people shows a weak positive correlation between the proportion of Afghans and poverty level among single females in the United States with a correlation coefficient (R) of 0.232 and weighted average of 19.5%, a difference of 1.4%.
Single Female Poverty Correlation Summary
| Measurement | Immigrants from Egypt | Afghan |
| Minimum | 3.9% | 5.1% |
| Maximum | 52.0% | 39.5% |
| Range | 48.1% | 34.4% |
| Mean | 20.5% | 20.2% |
| Median | 18.7% | 18.9% |
| Interquartile 25% (IQ1) | 14.6% | 15.9% |
| Interquartile 75% (IQ3) | 23.1% | 23.2% |
| Interquartile Range (IQR) | 8.4% | 7.4% |
| Standard Deviation (Sample) | 9.9% | 7.1% |
| Standard Deviation (Population) | 9.7% | 7.1% |
Similar Demographics by Single Female Poverty
Demographics Similar to Immigrants from Egypt by Single Female Poverty
In terms of single female poverty, the demographic groups most similar to Immigrants from Egypt are Palestinian (19.2%, a difference of 0.040%), Laotian (19.3%, a difference of 0.040%), Cypriot (19.2%, a difference of 0.060%), Immigrants from Europe (19.2%, a difference of 0.080%), and Immigrants from Northern Europe (19.2%, a difference of 0.090%).
| Demographics | Rating | Rank | Single Female Poverty |
| Russians | 99.6 /100 | #60 | Exceptional 19.2% |
| Cambodians | 99.6 /100 | #61 | Exceptional 19.2% |
| Lithuanians | 99.6 /100 | #62 | Exceptional 19.2% |
| Immigrants | Northern Europe | 99.6 /100 | #63 | Exceptional 19.2% |
| Immigrants | Europe | 99.6 /100 | #64 | Exceptional 19.2% |
| Cypriots | 99.6 /100 | #65 | Exceptional 19.2% |
| Palestinians | 99.6 /100 | #66 | Exceptional 19.2% |
| Immigrants | Egypt | 99.6 /100 | #67 | Exceptional 19.2% |
| Laotians | 99.5 /100 | #68 | Exceptional 19.3% |
| Paraguayans | 99.5 /100 | #69 | Exceptional 19.3% |
| Immigrants | Jordan | 99.4 /100 | #70 | Exceptional 19.3% |
| Immigrants | South Eastern Asia | 99.4 /100 | #71 | Exceptional 19.3% |
| Immigrants | Latvia | 99.4 /100 | #72 | Exceptional 19.3% |
| Immigrants | Peru | 99.4 /100 | #73 | Exceptional 19.3% |
| Immigrants | Belarus | 99.4 /100 | #74 | Exceptional 19.3% |
Demographics Similar to Afghans by Single Female Poverty
In terms of single female poverty, the demographic groups most similar to Afghans are Immigrants from Ukraine (19.5%, a difference of 0.010%), Zimbabwean (19.5%, a difference of 0.020%), Immigrants from Lebanon (19.6%, a difference of 0.19%), Soviet Union (19.6%, a difference of 0.25%), and Italian (19.6%, a difference of 0.30%).
| Demographics | Rating | Rank | Single Female Poverty |
| Immigrants | Scotland | 99.2 /100 | #81 | Exceptional 19.4% |
| Immigrants | Malaysia | 99.2 /100 | #82 | Exceptional 19.4% |
| Taiwanese | 99.2 /100 | #83 | Exceptional 19.4% |
| Immigrants | Sweden | 99.2 /100 | #84 | Exceptional 19.4% |
| Immigrants | Albania | 99.2 /100 | #85 | Exceptional 19.4% |
| Greeks | 99.2 /100 | #86 | Exceptional 19.4% |
| Zimbabweans | 99.0 /100 | #87 | Exceptional 19.5% |
| Afghans | 99.0 /100 | #88 | Exceptional 19.5% |
| Immigrants | Ukraine | 99.0 /100 | #89 | Exceptional 19.5% |
| Immigrants | Lebanon | 98.8 /100 | #90 | Exceptional 19.6% |
| Soviet Union | 98.8 /100 | #91 | Exceptional 19.6% |
| Italians | 98.8 /100 | #92 | Exceptional 19.6% |
| Immigrants | Austria | 98.8 /100 | #93 | Exceptional 19.6% |
| Romanians | 98.6 /100 | #94 | Exceptional 19.6% |
| Estonians | 98.2 /100 | #95 | Exceptional 19.7% |