Immigrants from Egypt vs Afghan Per Capita Income
COMPARE
Immigrants from Egypt
Afghan
Per Capita Income
Per Capita Income Comparison
Immigrants from Egypt
Afghans
$47,361
PER CAPITA INCOME
98.5/ 100
METRIC RATING
95th/ 347
METRIC RANK
$46,268
PER CAPITA INCOME
94.9/ 100
METRIC RATING
114th/ 347
METRIC RANK
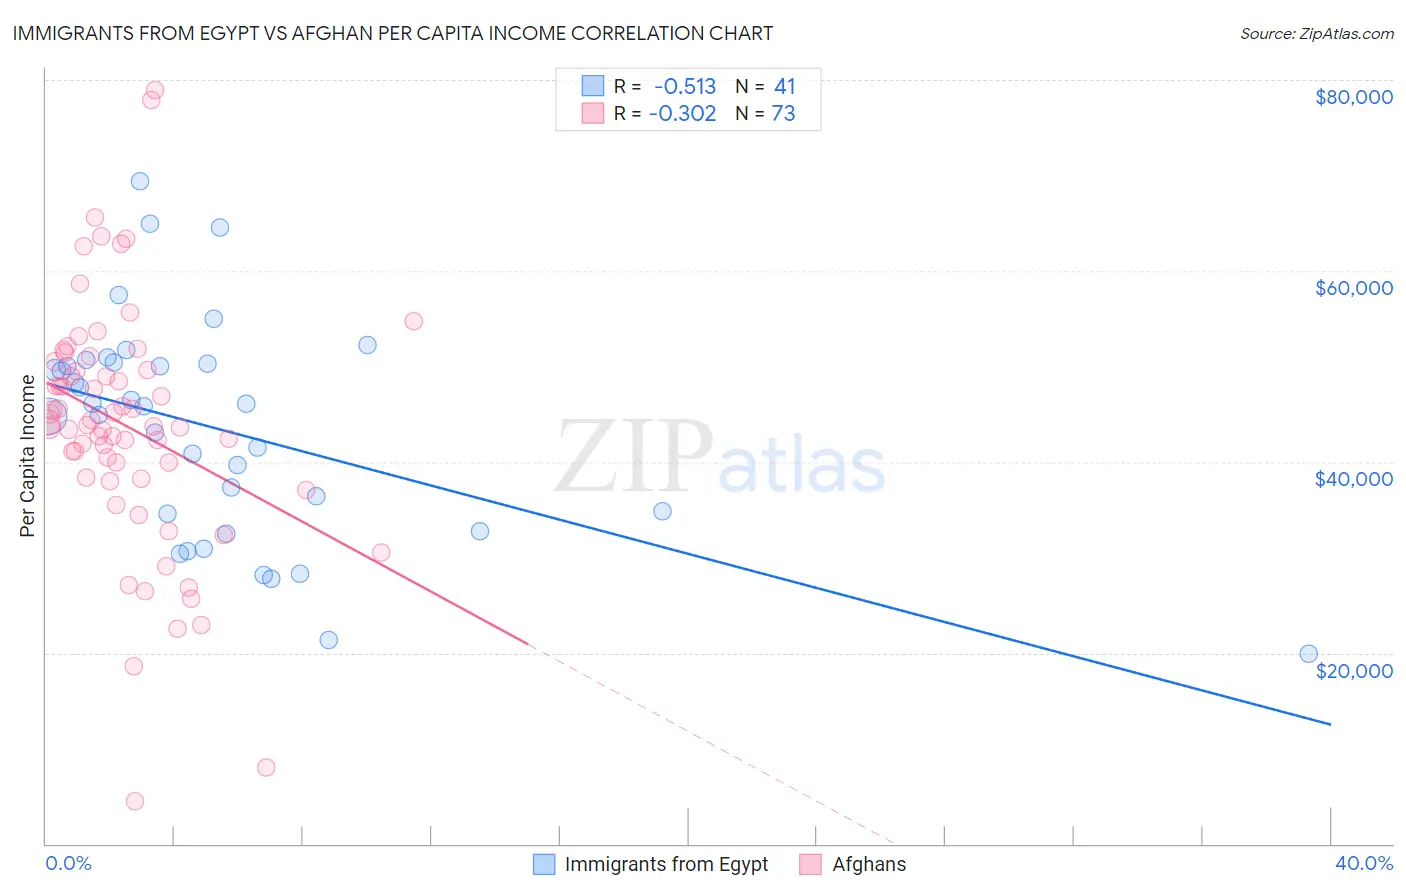
Immigrants from Egypt vs Afghan Per Capita Income Correlation Chart
The statistical analysis conducted on geographies consisting of 245,495,655 people shows a substantial negative correlation between the proportion of Immigrants from Egypt and per capita income in the United States with a correlation coefficient (R) of -0.513 and weighted average of $47,361. Similarly, the statistical analysis conducted on geographies consisting of 148,874,934 people shows a mild negative correlation between the proportion of Afghans and per capita income in the United States with a correlation coefficient (R) of -0.302 and weighted average of $46,268, a difference of 2.4%.
Per Capita Income Correlation Summary
| Measurement | Immigrants from Egypt | Afghan |
| Minimum | $19,900 | $4,471 |
| Maximum | $69,371 | $78,942 |
| Range | $49,471 | $74,471 |
| Mean | $43,359 | $43,744 |
| Median | $45,851 | $43,810 |
| Interquartile 25% (IQ1) | $33,676 | $38,293 |
| Interquartile 75% (IQ3) | $50,334 | $50,059 |
| Interquartile Range (IQR) | $16,658 | $11,766 |
| Standard Deviation (Sample) | $11,446 | $13,009 |
| Standard Deviation (Population) | $11,305 | $12,919 |
Demographics Similar to Immigrants from Egypt and Afghans by Per Capita Income
In terms of per capita income, the demographic groups most similar to Immigrants from Egypt are Albanian ($47,379, a difference of 0.040%), Alsatian ($47,284, a difference of 0.16%), Carpatho Rusyn ($47,248, a difference of 0.24%), Immigrants from Pakistan ($47,084, a difference of 0.59%), and Laotian ($47,041, a difference of 0.68%). Similarly, the demographic groups most similar to Afghans are Immigrants from Albania ($46,387, a difference of 0.26%), Immigrants from Morocco ($46,430, a difference of 0.35%), Taiwanese ($46,455, a difference of 0.40%), Chilean ($46,459, a difference of 0.41%), and Immigrants from Northern Africa ($46,531, a difference of 0.57%).
| Demographics | Rating | Rank | Per Capita Income |
| Albanians | 98.5 /100 | #94 | Exceptional $47,379 |
| Immigrants | Egypt | 98.5 /100 | #95 | Exceptional $47,361 |
| Alsatians | 98.3 /100 | #96 | Exceptional $47,284 |
| Carpatho Rusyns | 98.2 /100 | #97 | Exceptional $47,248 |
| Immigrants | Pakistan | 97.9 /100 | #98 | Exceptional $47,084 |
| Laotians | 97.8 /100 | #99 | Exceptional $47,041 |
| Immigrants | Lebanon | 97.5 /100 | #100 | Exceptional $46,938 |
| Immigrants | Uzbekistan | 97.5 /100 | #101 | Exceptional $46,929 |
| Immigrants | Western Asia | 97.4 /100 | #102 | Exceptional $46,876 |
| Syrians | 97.2 /100 | #103 | Exceptional $46,837 |
| Brazilians | 96.8 /100 | #104 | Exceptional $46,700 |
| British | 96.3 /100 | #105 | Exceptional $46,571 |
| Ethiopians | 96.3 /100 | #106 | Exceptional $46,569 |
| Serbians | 96.2 /100 | #107 | Exceptional $46,551 |
| Immigrants | Kuwait | 96.2 /100 | #108 | Exceptional $46,543 |
| Immigrants | Northern Africa | 96.2 /100 | #109 | Exceptional $46,531 |
| Chileans | 95.9 /100 | #110 | Exceptional $46,459 |
| Taiwanese | 95.8 /100 | #111 | Exceptional $46,455 |
| Immigrants | Morocco | 95.7 /100 | #112 | Exceptional $46,430 |
| Immigrants | Albania | 95.5 /100 | #113 | Exceptional $46,387 |
| Afghans | 94.9 /100 | #114 | Exceptional $46,268 |