Immigrants from Egypt vs Afghan Ambulatory Disability
COMPARE
Immigrants from Egypt
Afghan
Ambulatory Disability
Ambulatory Disability Comparison
Immigrants from Egypt
Afghans
5.6%
AMBULATORY DISABILITY
99.8/ 100
METRIC RATING
53rd/ 347
METRIC RANK
5.5%
AMBULATORY DISABILITY
100.0/ 100
METRIC RATING
35th/ 347
METRIC RANK
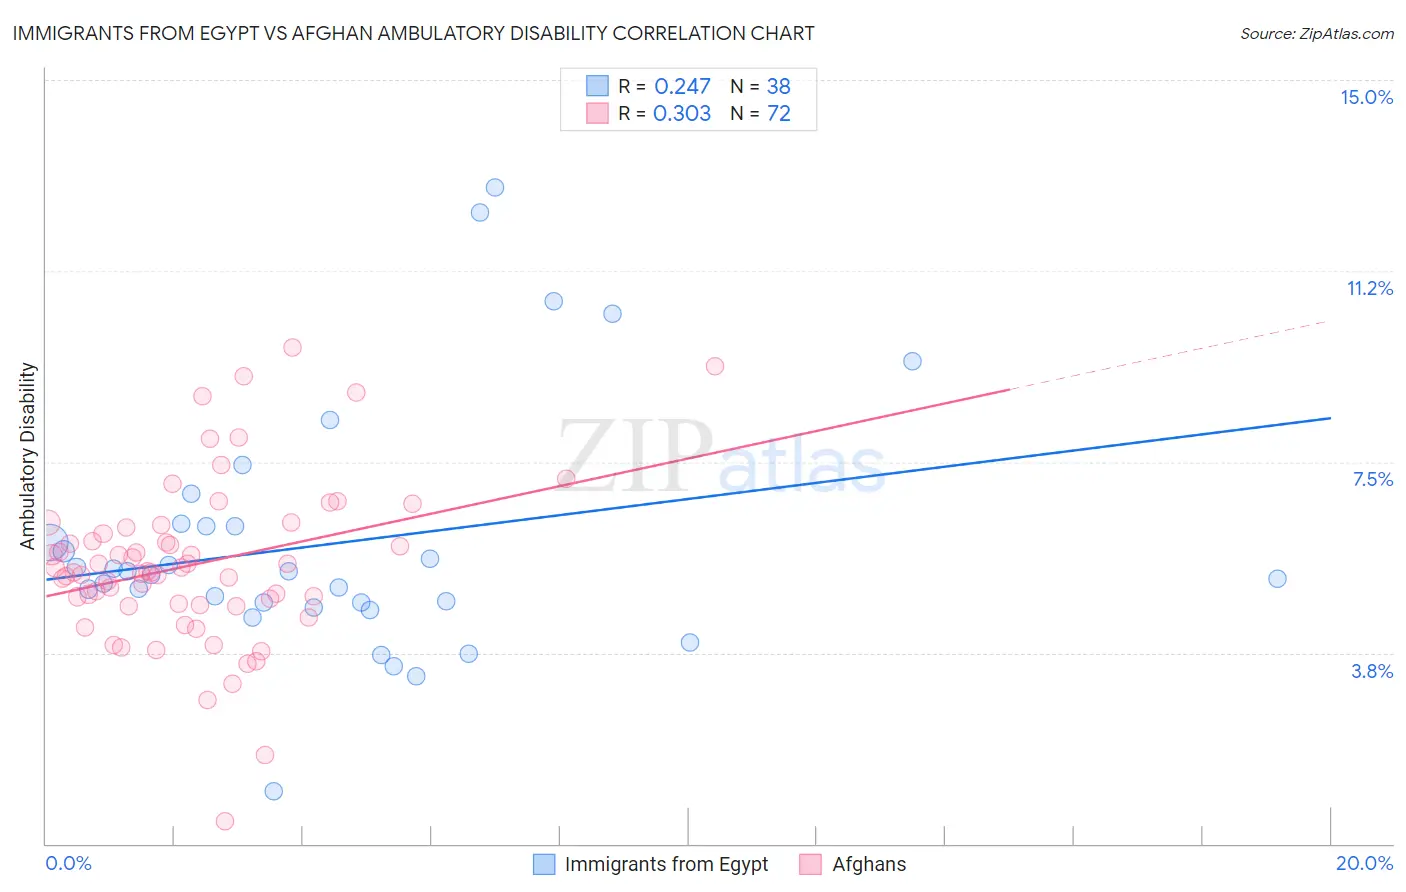
Immigrants from Egypt vs Afghan Ambulatory Disability Correlation Chart
The statistical analysis conducted on geographies consisting of 245,460,331 people shows a weak positive correlation between the proportion of Immigrants from Egypt and percentage of population with ambulatory disability in the United States with a correlation coefficient (R) of 0.247 and weighted average of 5.6%. Similarly, the statistical analysis conducted on geographies consisting of 148,854,459 people shows a mild positive correlation between the proportion of Afghans and percentage of population with ambulatory disability in the United States with a correlation coefficient (R) of 0.303 and weighted average of 5.5%, a difference of 2.3%.
Ambulatory Disability Correlation Summary
| Measurement | Immigrants from Egypt | Afghan |
| Minimum | 1.0% | 0.43% |
| Maximum | 12.9% | 9.8% |
| Range | 11.9% | 9.3% |
| Mean | 5.9% | 5.5% |
| Median | 5.3% | 5.3% |
| Interquartile 25% (IQ1) | 4.7% | 4.7% |
| Interquartile 75% (IQ3) | 6.2% | 6.2% |
| Interquartile Range (IQR) | 1.5% | 1.5% |
| Standard Deviation (Sample) | 2.4% | 1.6% |
| Standard Deviation (Population) | 2.4% | 1.6% |
Demographics Similar to Immigrants from Egypt and Afghans by Ambulatory Disability
In terms of ambulatory disability, the demographic groups most similar to Immigrants from Egypt are Jordanian (5.6%, a difference of 0.010%), Immigrants from Eastern Africa (5.6%, a difference of 0.050%), Taiwanese (5.6%, a difference of 0.10%), Luxembourger (5.6%, a difference of 0.20%), and Bulgarian (5.6%, a difference of 0.54%). Similarly, the demographic groups most similar to Afghans are Immigrants from Asia (5.5%, a difference of 0.040%), Immigrants from Malaysia (5.5%, a difference of 0.070%), Turkish (5.5%, a difference of 0.080%), Cypriot (5.5%, a difference of 0.090%), and Immigrants from Eritrea (5.5%, a difference of 0.18%).
| Demographics | Rating | Rank | Ambulatory Disability |
| Immigrants | Asia | 100.0 /100 | #34 | Exceptional 5.5% |
| Afghans | 100.0 /100 | #35 | Exceptional 5.5% |
| Immigrants | Malaysia | 100.0 /100 | #36 | Exceptional 5.5% |
| Turks | 100.0 /100 | #37 | Exceptional 5.5% |
| Cypriots | 100.0 /100 | #38 | Exceptional 5.5% |
| Immigrants | Eritrea | 100.0 /100 | #39 | Exceptional 5.5% |
| Venezuelans | 99.9 /100 | #40 | Exceptional 5.5% |
| Mongolians | 99.9 /100 | #41 | Exceptional 5.5% |
| Argentineans | 99.9 /100 | #42 | Exceptional 5.5% |
| Paraguayans | 99.9 /100 | #43 | Exceptional 5.5% |
| Immigrants | Indonesia | 99.9 /100 | #44 | Exceptional 5.5% |
| Immigrants | Sweden | 99.9 /100 | #45 | Exceptional 5.6% |
| Egyptians | 99.9 /100 | #46 | Exceptional 5.6% |
| Immigrants | Japan | 99.9 /100 | #47 | Exceptional 5.6% |
| Immigrants | Argentina | 99.9 /100 | #48 | Exceptional 5.6% |
| Bulgarians | 99.9 /100 | #49 | Exceptional 5.6% |
| Luxembourgers | 99.9 /100 | #50 | Exceptional 5.6% |
| Taiwanese | 99.8 /100 | #51 | Exceptional 5.6% |
| Jordanians | 99.8 /100 | #52 | Exceptional 5.6% |
| Immigrants | Egypt | 99.8 /100 | #53 | Exceptional 5.6% |
| Immigrants | Eastern Africa | 99.8 /100 | #54 | Exceptional 5.6% |