Immigrants from Dominican Republic vs Afghan Single Female Poverty
COMPARE
Immigrants from Dominican Republic
Afghan
Single Female Poverty
Single Female Poverty Comparison
Immigrants from Dominican Republic
Afghans
25.3%
SINGLE FEMALE POVERTY
0.0/ 100
METRIC RATING
305th/ 347
METRIC RANK
19.5%
SINGLE FEMALE POVERTY
99.0/ 100
METRIC RATING
88th/ 347
METRIC RANK
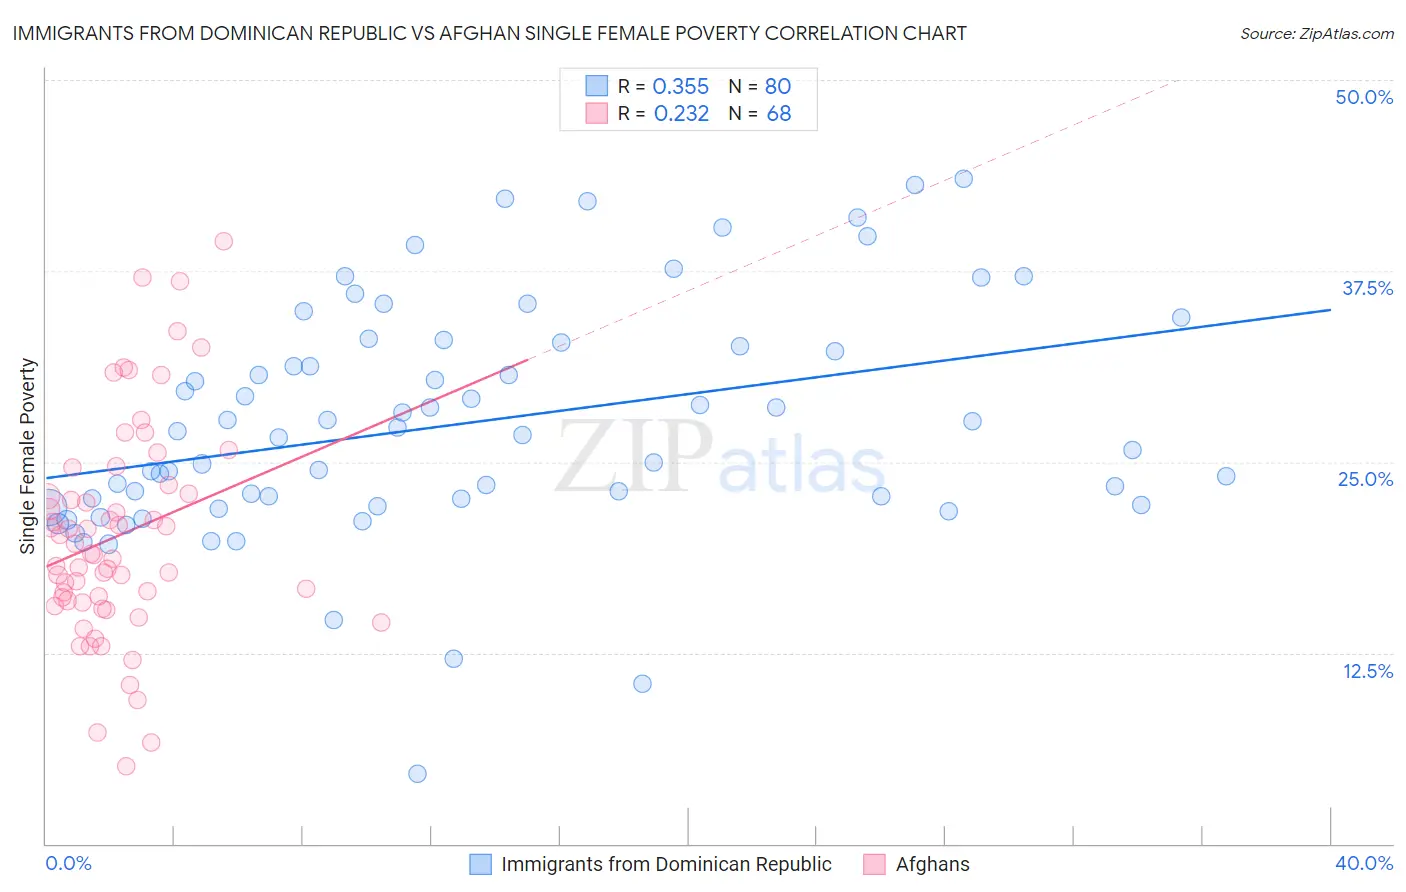
Immigrants from Dominican Republic vs Afghan Single Female Poverty Correlation Chart
The statistical analysis conducted on geographies consisting of 271,687,011 people shows a mild positive correlation between the proportion of Immigrants from Dominican Republic and poverty level among single females in the United States with a correlation coefficient (R) of 0.355 and weighted average of 25.3%. Similarly, the statistical analysis conducted on geographies consisting of 148,055,541 people shows a weak positive correlation between the proportion of Afghans and poverty level among single females in the United States with a correlation coefficient (R) of 0.232 and weighted average of 19.5%, a difference of 29.6%.
Single Female Poverty Correlation Summary
| Measurement | Immigrants from Dominican Republic | Afghan |
| Minimum | 4.6% | 5.1% |
| Maximum | 43.6% | 39.5% |
| Range | 39.0% | 34.4% |
| Mean | 27.5% | 20.2% |
| Median | 26.9% | 18.9% |
| Interquartile 25% (IQ1) | 22.4% | 15.9% |
| Interquartile 75% (IQ3) | 32.7% | 23.2% |
| Interquartile Range (IQR) | 10.3% | 7.4% |
| Standard Deviation (Sample) | 7.7% | 7.1% |
| Standard Deviation (Population) | 7.6% | 7.1% |
Similar Demographics by Single Female Poverty
Demographics Similar to Immigrants from Dominican Republic by Single Female Poverty
In terms of single female poverty, the demographic groups most similar to Immigrants from Dominican Republic are Immigrants from Congo (25.3%, a difference of 0.010%), Immigrants from Mexico (25.3%, a difference of 0.10%), Somali (25.2%, a difference of 0.28%), Potawatomi (25.4%, a difference of 0.32%), and Aleut (25.4%, a difference of 0.49%).
| Demographics | Rating | Rank | Single Female Poverty |
| Yaqui | 0.0 /100 | #298 | Tragic 24.9% |
| Mexicans | 0.0 /100 | #299 | Tragic 25.0% |
| Blackfeet | 0.0 /100 | #300 | Tragic 25.1% |
| Hondurans | 0.0 /100 | #301 | Tragic 25.1% |
| Shoshone | 0.0 /100 | #302 | Tragic 25.1% |
| Somalis | 0.0 /100 | #303 | Tragic 25.2% |
| Immigrants | Congo | 0.0 /100 | #304 | Tragic 25.3% |
| Immigrants | Dominican Republic | 0.0 /100 | #305 | Tragic 25.3% |
| Immigrants | Mexico | 0.0 /100 | #306 | Tragic 25.3% |
| Potawatomi | 0.0 /100 | #307 | Tragic 25.4% |
| Aleuts | 0.0 /100 | #308 | Tragic 25.4% |
| Dominicans | 0.0 /100 | #309 | Tragic 25.4% |
| Central American Indians | 0.0 /100 | #310 | Tragic 25.5% |
| Immigrants | Honduras | 0.0 /100 | #311 | Tragic 25.5% |
| Paiute | 0.0 /100 | #312 | Tragic 25.5% |
Demographics Similar to Afghans by Single Female Poverty
In terms of single female poverty, the demographic groups most similar to Afghans are Immigrants from Ukraine (19.5%, a difference of 0.010%), Zimbabwean (19.5%, a difference of 0.020%), Immigrants from Lebanon (19.6%, a difference of 0.19%), Soviet Union (19.6%, a difference of 0.25%), and Italian (19.6%, a difference of 0.30%).
| Demographics | Rating | Rank | Single Female Poverty |
| Immigrants | Scotland | 99.2 /100 | #81 | Exceptional 19.4% |
| Immigrants | Malaysia | 99.2 /100 | #82 | Exceptional 19.4% |
| Taiwanese | 99.2 /100 | #83 | Exceptional 19.4% |
| Immigrants | Sweden | 99.2 /100 | #84 | Exceptional 19.4% |
| Immigrants | Albania | 99.2 /100 | #85 | Exceptional 19.4% |
| Greeks | 99.2 /100 | #86 | Exceptional 19.4% |
| Zimbabweans | 99.0 /100 | #87 | Exceptional 19.5% |
| Afghans | 99.0 /100 | #88 | Exceptional 19.5% |
| Immigrants | Ukraine | 99.0 /100 | #89 | Exceptional 19.5% |
| Immigrants | Lebanon | 98.8 /100 | #90 | Exceptional 19.6% |
| Soviet Union | 98.8 /100 | #91 | Exceptional 19.6% |
| Italians | 98.8 /100 | #92 | Exceptional 19.6% |
| Immigrants | Austria | 98.8 /100 | #93 | Exceptional 19.6% |
| Romanians | 98.6 /100 | #94 | Exceptional 19.6% |
| Estonians | 98.2 /100 | #95 | Exceptional 19.7% |