Immigrants from Norway vs Mongolian Single Male Poverty
COMPARE
Immigrants from Norway
Mongolian
Single Male Poverty
Single Male Poverty Comparison
Immigrants from Norway
Mongolians
13.0%
SINGLE MALE POVERTY
21.8/ 100
METRIC RATING
199th/ 347
METRIC RANK
12.2%
SINGLE MALE POVERTY
97.7/ 100
METRIC RATING
95th/ 347
METRIC RANK
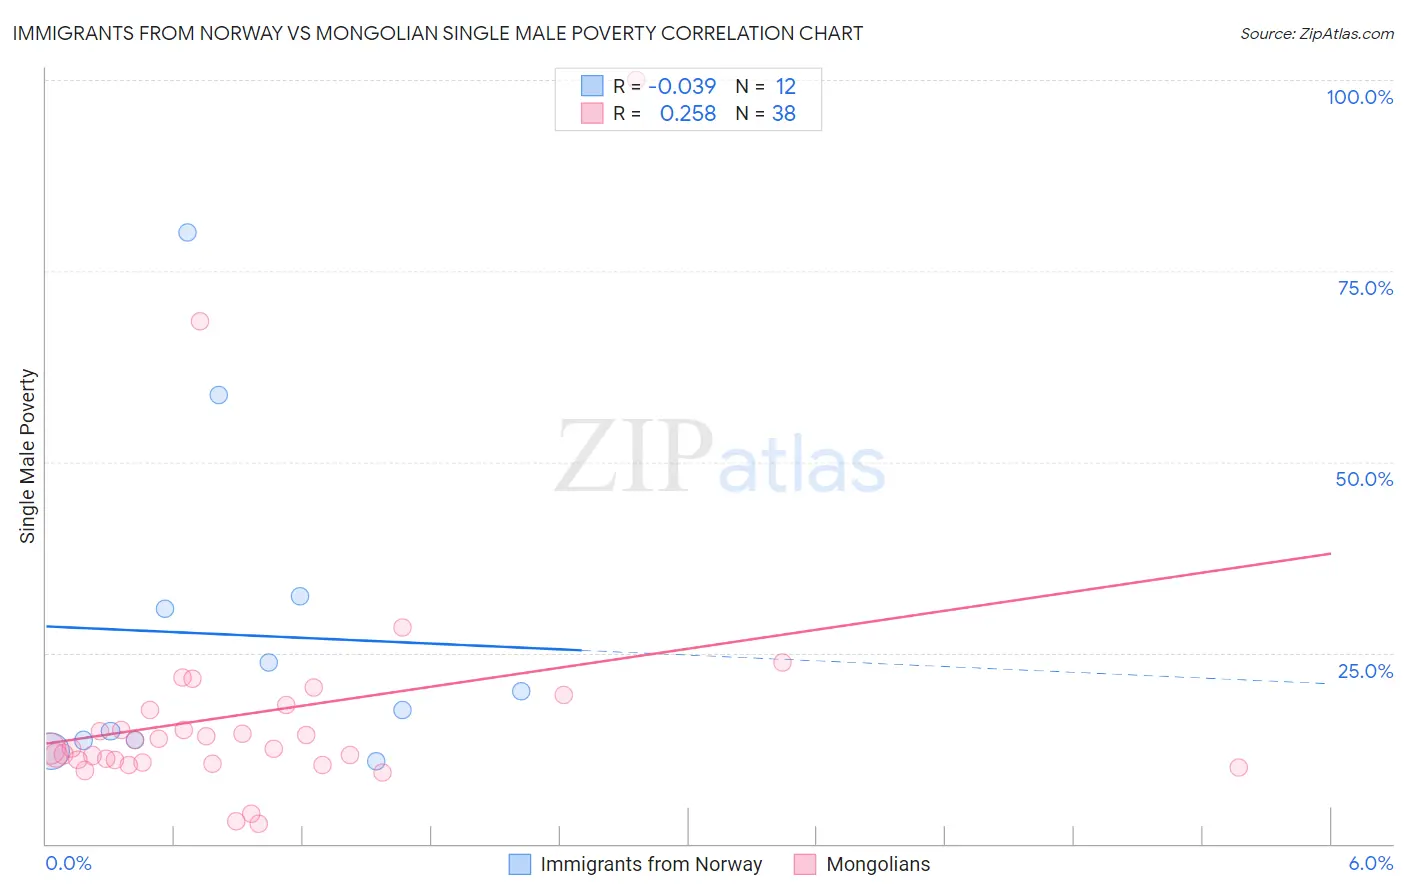
Immigrants from Norway vs Mongolian Single Male Poverty Correlation Chart
The statistical analysis conducted on geographies consisting of 108,569,706 people shows no correlation between the proportion of Immigrants from Norway and poverty level among single males in the United States with a correlation coefficient (R) of -0.039 and weighted average of 13.0%. Similarly, the statistical analysis conducted on geographies consisting of 132,546,705 people shows a weak positive correlation between the proportion of Mongolians and poverty level among single males in the United States with a correlation coefficient (R) of 0.258 and weighted average of 12.2%, a difference of 7.0%.
Single Male Poverty Correlation Summary
| Measurement | Immigrants from Norway | Mongolian |
| Minimum | 10.8% | 2.7% |
| Maximum | 80.0% | 100.0% |
| Range | 69.2% | 97.3% |
| Mean | 27.4% | 17.1% |
| Median | 18.8% | 12.5% |
| Interquartile 25% (IQ1) | 13.5% | 10.7% |
| Interquartile 75% (IQ3) | 31.6% | 17.6% |
| Interquartile Range (IQR) | 18.1% | 6.9% |
| Standard Deviation (Sample) | 21.3% | 17.3% |
| Standard Deviation (Population) | 20.4% | 17.0% |
Similar Demographics by Single Male Poverty
Demographics Similar to Immigrants from Norway by Single Male Poverty
In terms of single male poverty, the demographic groups most similar to Immigrants from Norway are Lithuanian (13.0%, a difference of 0.020%), Slovene (13.0%, a difference of 0.020%), Trinidadian and Tobagonian (13.0%, a difference of 0.030%), Basque (13.0%, a difference of 0.090%), and Immigrants from Grenada (13.0%, a difference of 0.10%).
| Demographics | Rating | Rank | Single Male Poverty |
| Immigrants | Jamaica | 26.5 /100 | #192 | Fair 13.0% |
| Immigrants | South Africa | 26.1 /100 | #193 | Fair 13.0% |
| Liberians | 25.2 /100 | #194 | Fair 13.0% |
| Immigrants | England | 23.4 /100 | #195 | Fair 13.0% |
| Immigrants | Grenada | 23.1 /100 | #196 | Fair 13.0% |
| Immigrants | Laos | 23.1 /100 | #197 | Fair 13.0% |
| Lithuanians | 22.1 /100 | #198 | Fair 13.0% |
| Immigrants | Norway | 21.8 /100 | #199 | Fair 13.0% |
| Slovenes | 21.6 /100 | #200 | Fair 13.0% |
| Trinidadians and Tobagonians | 21.4 /100 | #201 | Fair 13.0% |
| Basques | 20.7 /100 | #202 | Fair 13.0% |
| Immigrants | Bangladesh | 20.4 /100 | #203 | Fair 13.0% |
| Estonians | 20.3 /100 | #204 | Fair 13.0% |
| Poles | 19.3 /100 | #205 | Poor 13.0% |
| Northern Europeans | 18.9 /100 | #206 | Poor 13.0% |
Demographics Similar to Mongolians by Single Male Poverty
In terms of single male poverty, the demographic groups most similar to Mongolians are Colombian (12.2%, a difference of 0.010%), Immigrants from Bosnia and Herzegovina (12.1%, a difference of 0.13%), Immigrants from Sweden (12.2%, a difference of 0.15%), Spanish American Indian (12.1%, a difference of 0.19%), and Immigrants from Italy (12.2%, a difference of 0.20%).
| Demographics | Rating | Rank | Single Male Poverty |
| Immigrants | Eritrea | 98.5 /100 | #88 | Exceptional 12.1% |
| Immigrants | Ireland | 98.3 /100 | #89 | Exceptional 12.1% |
| South American Indians | 98.3 /100 | #90 | Exceptional 12.1% |
| Immigrants | Turkey | 98.2 /100 | #91 | Exceptional 12.1% |
| Spanish American Indians | 98.0 /100 | #92 | Exceptional 12.1% |
| Immigrants | Bosnia and Herzegovina | 97.9 /100 | #93 | Exceptional 12.1% |
| Colombians | 97.8 /100 | #94 | Exceptional 12.2% |
| Mongolians | 97.7 /100 | #95 | Exceptional 12.2% |
| Immigrants | Sweden | 97.5 /100 | #96 | Exceptional 12.2% |
| Immigrants | Italy | 97.4 /100 | #97 | Exceptional 12.2% |
| Guamanians/Chamorros | 97.4 /100 | #98 | Exceptional 12.2% |
| Immigrants | Cuba | 97.3 /100 | #99 | Exceptional 12.2% |
| Immigrants | Australia | 97.1 /100 | #100 | Exceptional 12.2% |
| Immigrants | Latvia | 97.0 /100 | #101 | Exceptional 12.2% |
| Immigrants | Europe | 97.0 /100 | #102 | Exceptional 12.2% |