Immigrants from Dominican Republic vs Afghan In Labor Force | Age 45-54
COMPARE
Immigrants from Dominican Republic
Afghan
In Labor Force | Age 45-54
In Labor Force | Age 45-54 Comparison
Immigrants from Dominican Republic
Afghans
80.1%
IN LABOR FORCE | AGE 45-54
0.0/ 100
METRIC RATING
305th/ 347
METRIC RANK
83.5%
IN LABOR FORCE | AGE 45-54
97.9/ 100
METRIC RATING
63rd/ 347
METRIC RANK
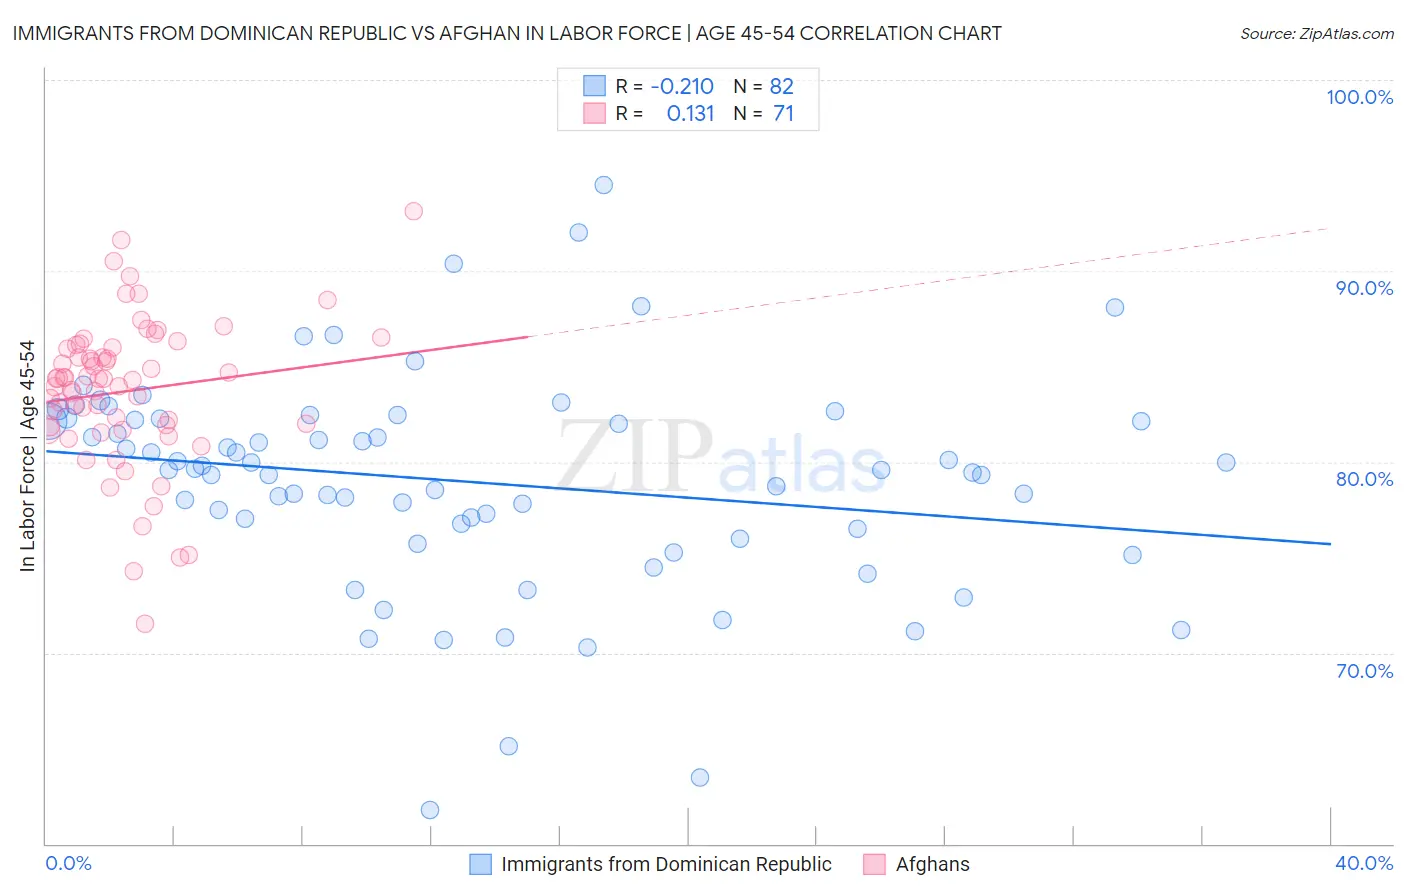
Immigrants from Dominican Republic vs Afghan In Labor Force | Age 45-54 Correlation Chart
The statistical analysis conducted on geographies consisting of 274,956,720 people shows a weak negative correlation between the proportion of Immigrants from Dominican Republic and labor force participation rate among population between the ages 45 and 54 in the United States with a correlation coefficient (R) of -0.210 and weighted average of 80.1%. Similarly, the statistical analysis conducted on geographies consisting of 148,803,008 people shows a poor positive correlation between the proportion of Afghans and labor force participation rate among population between the ages 45 and 54 in the United States with a correlation coefficient (R) of 0.131 and weighted average of 83.5%, a difference of 4.2%.
In Labor Force | Age 45-54 Correlation Summary
| Measurement | Immigrants from Dominican Republic | Afghan |
| Minimum | 61.8% | 71.5% |
| Maximum | 94.5% | 93.1% |
| Range | 32.7% | 21.6% |
| Mean | 79.0% | 83.7% |
| Median | 79.6% | 84.3% |
| Interquartile 25% (IQ1) | 76.5% | 81.9% |
| Interquartile 75% (IQ3) | 82.2% | 86.0% |
| Interquartile Range (IQR) | 5.7% | 4.1% |
| Standard Deviation (Sample) | 5.7% | 3.9% |
| Standard Deviation (Population) | 5.6% | 3.8% |
Similar Demographics by In Labor Force | Age 45-54
Demographics Similar to Immigrants from Dominican Republic by In Labor Force | Age 45-54
In terms of in labor force | age 45-54, the demographic groups most similar to Immigrants from Dominican Republic are Hispanic or Latino (80.1%, a difference of 0.010%), Immigrants from the Azores (80.1%, a difference of 0.030%), Spanish American (80.1%, a difference of 0.040%), Immigrants from Central America (80.2%, a difference of 0.090%), and Blackfeet (80.0%, a difference of 0.12%).
| Demographics | Rating | Rank | In Labor Force | Age 45-54 |
| Marshallese | 0.0 /100 | #298 | Tragic 80.3% |
| Dominicans | 0.0 /100 | #299 | Tragic 80.3% |
| Fijians | 0.0 /100 | #300 | Tragic 80.2% |
| Spanish American Indians | 0.0 /100 | #301 | Tragic 80.2% |
| Immigrants | Central America | 0.0 /100 | #302 | Tragic 80.2% |
| Immigrants | Azores | 0.0 /100 | #303 | Tragic 80.1% |
| Hispanics or Latinos | 0.0 /100 | #304 | Tragic 80.1% |
| Immigrants | Dominican Republic | 0.0 /100 | #305 | Tragic 80.1% |
| Spanish Americans | 0.0 /100 | #306 | Tragic 80.1% |
| Blackfeet | 0.0 /100 | #307 | Tragic 80.0% |
| Central American Indians | 0.0 /100 | #308 | Tragic 80.0% |
| Potawatomi | 0.0 /100 | #309 | Tragic 80.0% |
| Inupiat | 0.0 /100 | #310 | Tragic 79.9% |
| Mexicans | 0.0 /100 | #311 | Tragic 79.8% |
| Immigrants | Mexico | 0.0 /100 | #312 | Tragic 79.7% |
Demographics Similar to Afghans by In Labor Force | Age 45-54
In terms of in labor force | age 45-54, the demographic groups most similar to Afghans are Immigrants from Kenya (83.5%, a difference of 0.0%), Immigrants from Taiwan (83.5%, a difference of 0.010%), Egyptian (83.5%, a difference of 0.010%), Asian (83.4%, a difference of 0.020%), and Chilean (83.4%, a difference of 0.020%).
| Demographics | Rating | Rank | In Labor Force | Age 45-54 |
| Immigrants | Peru | 98.6 /100 | #56 | Exceptional 83.5% |
| Paraguayans | 98.5 /100 | #57 | Exceptional 83.5% |
| Eastern Europeans | 98.5 /100 | #58 | Exceptional 83.5% |
| Bhutanese | 98.3 /100 | #59 | Exceptional 83.5% |
| Carpatho Rusyns | 98.3 /100 | #60 | Exceptional 83.5% |
| Filipinos | 98.3 /100 | #61 | Exceptional 83.5% |
| Immigrants | Taiwan | 98.0 /100 | #62 | Exceptional 83.5% |
| Afghans | 97.9 /100 | #63 | Exceptional 83.5% |
| Immigrants | Kenya | 97.9 /100 | #64 | Exceptional 83.5% |
| Egyptians | 97.9 /100 | #65 | Exceptional 83.5% |
| Asians | 97.7 /100 | #66 | Exceptional 83.4% |
| Chileans | 97.7 /100 | #67 | Exceptional 83.4% |
| Immigrants | Colombia | 97.6 /100 | #68 | Exceptional 83.4% |
| Taiwanese | 97.5 /100 | #69 | Exceptional 83.4% |
| Immigrants | Latvia | 97.4 /100 | #70 | Exceptional 83.4% |