Immigrants from Dominican Republic vs Afghan In Labor Force | Age 35-44
COMPARE
Immigrants from Dominican Republic
Afghan
In Labor Force | Age 35-44
In Labor Force | Age 35-44 Comparison
Immigrants from Dominican Republic
Afghans
82.9%
IN LABOR FORCE | AGE 35-44
0.0/ 100
METRIC RATING
284th/ 347
METRIC RANK
84.6%
IN LABOR FORCE | AGE 35-44
86.3/ 100
METRIC RATING
136th/ 347
METRIC RANK
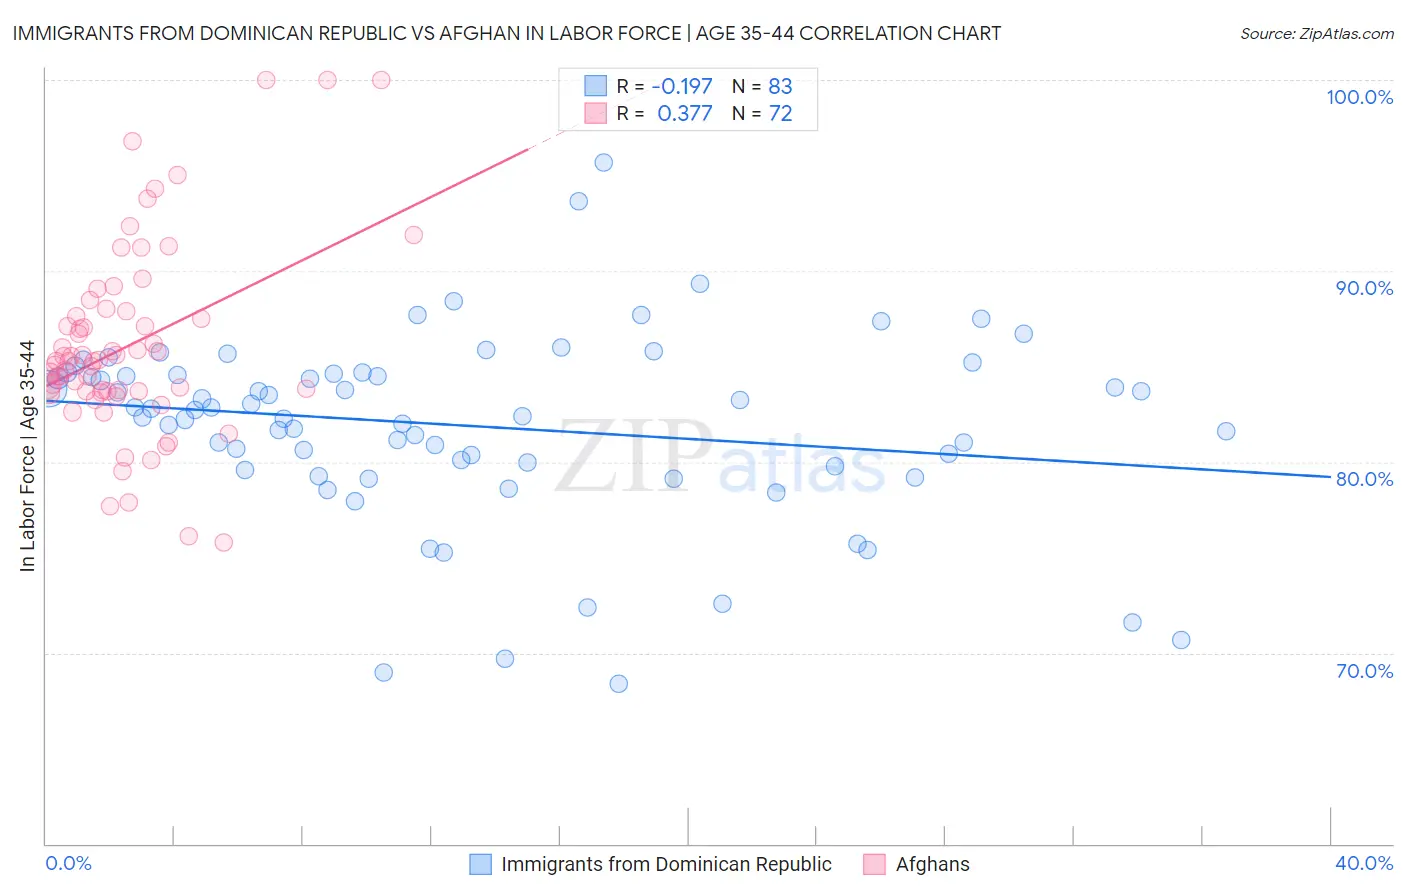
Immigrants from Dominican Republic vs Afghan In Labor Force | Age 35-44 Correlation Chart
The statistical analysis conducted on geographies consisting of 275,005,604 people shows a poor negative correlation between the proportion of Immigrants from Dominican Republic and labor force participation rate among population between the ages 35 and 44 in the United States with a correlation coefficient (R) of -0.197 and weighted average of 82.9%. Similarly, the statistical analysis conducted on geographies consisting of 148,851,907 people shows a mild positive correlation between the proportion of Afghans and labor force participation rate among population between the ages 35 and 44 in the United States with a correlation coefficient (R) of 0.377 and weighted average of 84.6%, a difference of 2.0%.
In Labor Force | Age 35-44 Correlation Summary
| Measurement | Immigrants from Dominican Republic | Afghan |
| Minimum | 68.4% | 75.8% |
| Maximum | 95.7% | 100.0% |
| Range | 27.3% | 24.2% |
| Mean | 81.9% | 86.1% |
| Median | 82.7% | 85.3% |
| Interquartile 25% (IQ1) | 79.8% | 83.7% |
| Interquartile 75% (IQ3) | 84.6% | 87.8% |
| Interquartile Range (IQR) | 4.9% | 4.1% |
| Standard Deviation (Sample) | 4.9% | 5.0% |
| Standard Deviation (Population) | 4.9% | 5.0% |
Similar Demographics by In Labor Force | Age 35-44
Demographics Similar to Immigrants from Dominican Republic by In Labor Force | Age 35-44
In terms of in labor force | age 35-44, the demographic groups most similar to Immigrants from Dominican Republic are Osage (82.9%, a difference of 0.010%), Immigrants from Guatemala (82.9%, a difference of 0.010%), Fijian (82.9%, a difference of 0.010%), Immigrants from Bangladesh (82.9%, a difference of 0.010%), and Immigrants from Belize (82.9%, a difference of 0.020%).
| Demographics | Rating | Rank | In Labor Force | Age 35-44 |
| Samoans | 0.0 /100 | #277 | Tragic 83.2% |
| Belizeans | 0.0 /100 | #278 | Tragic 83.1% |
| Immigrants | Micronesia | 0.0 /100 | #279 | Tragic 83.1% |
| Dominicans | 0.0 /100 | #280 | Tragic 83.1% |
| Guatemalans | 0.0 /100 | #281 | Tragic 83.0% |
| Osage | 0.0 /100 | #282 | Tragic 82.9% |
| Immigrants | Guatemala | 0.0 /100 | #283 | Tragic 82.9% |
| Immigrants | Dominican Republic | 0.0 /100 | #284 | Tragic 82.9% |
| Fijians | 0.0 /100 | #285 | Tragic 82.9% |
| Immigrants | Bangladesh | 0.0 /100 | #286 | Tragic 82.9% |
| Immigrants | Belize | 0.0 /100 | #287 | Tragic 82.9% |
| Puget Sound Salish | 0.0 /100 | #288 | Tragic 82.9% |
| Chippewa | 0.0 /100 | #289 | Tragic 82.9% |
| Africans | 0.0 /100 | #290 | Tragic 82.9% |
| Pennsylvania Germans | 0.0 /100 | #291 | Tragic 82.9% |
Demographics Similar to Afghans by In Labor Force | Age 35-44
In terms of in labor force | age 35-44, the demographic groups most similar to Afghans are Immigrants from Malaysia (84.6%, a difference of 0.020%), Immigrants from Chile (84.6%, a difference of 0.020%), Argentinean (84.6%, a difference of 0.030%), Immigrants from Korea (84.6%, a difference of 0.030%), and Czechoslovakian (84.6%, a difference of 0.040%).
| Demographics | Rating | Rank | In Labor Force | Age 35-44 |
| Palestinians | 89.7 /100 | #129 | Excellent 84.7% |
| Bhutanese | 89.7 /100 | #130 | Excellent 84.7% |
| Immigrants | Scotland | 89.6 /100 | #131 | Excellent 84.7% |
| Austrians | 89.4 /100 | #132 | Excellent 84.7% |
| Argentineans | 88.4 /100 | #133 | Excellent 84.6% |
| Immigrants | Korea | 88.2 /100 | #134 | Excellent 84.6% |
| Immigrants | Malaysia | 87.5 /100 | #135 | Excellent 84.6% |
| Afghans | 86.3 /100 | #136 | Excellent 84.6% |
| Immigrants | Chile | 84.6 /100 | #137 | Excellent 84.6% |
| Czechoslovakians | 82.6 /100 | #138 | Excellent 84.6% |
| Immigrants | Zaire | 82.5 /100 | #139 | Excellent 84.6% |
| Immigrants | Japan | 81.4 /100 | #140 | Excellent 84.6% |
| Immigrants | Belgium | 80.8 /100 | #141 | Excellent 84.6% |
| Immigrants | Uruguay | 80.1 /100 | #142 | Excellent 84.6% |
| Immigrants | Ukraine | 79.7 /100 | #143 | Good 84.6% |