Immigrants from Dominica vs Mexican American Indian Single Mother Poverty
COMPARE
Immigrants from Dominica
Mexican American Indian
Single Mother Poverty
Single Mother Poverty Comparison
Immigrants from Dominica
Mexican American Indians
32.5%
SINGLE MOTHER POVERTY
0.0/ 100
METRIC RATING
287th/ 347
METRIC RANK
31.9%
SINGLE MOTHER POVERTY
0.0/ 100
METRIC RATING
277th/ 347
METRIC RANK
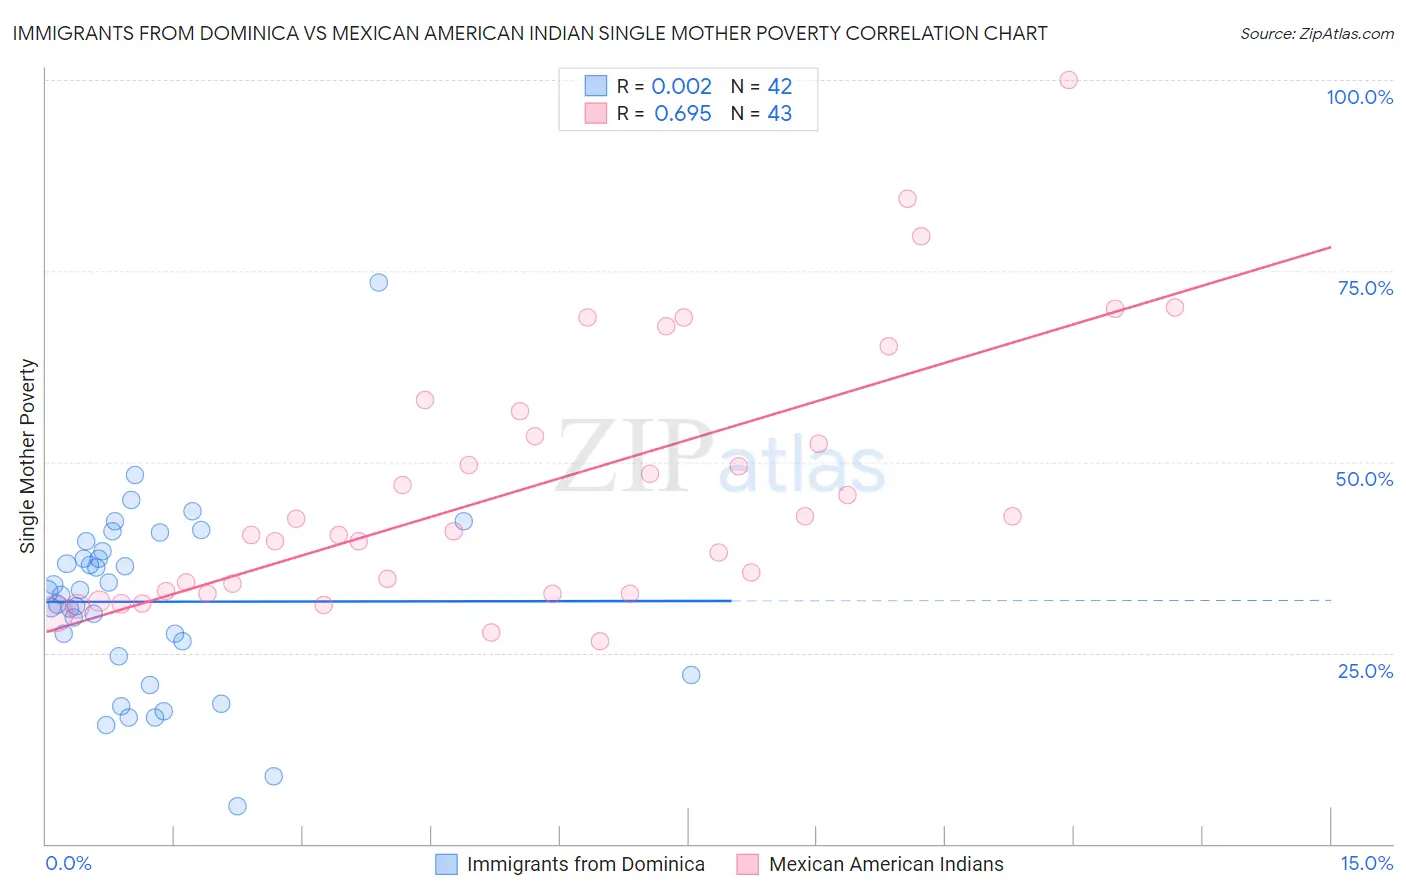
Immigrants from Dominica vs Mexican American Indian Single Mother Poverty Correlation Chart
The statistical analysis conducted on geographies consisting of 83,555,072 people shows no correlation between the proportion of Immigrants from Dominica and poverty level among single mothers in the United States with a correlation coefficient (R) of 0.002 and weighted average of 32.5%. Similarly, the statistical analysis conducted on geographies consisting of 314,019,371 people shows a significant positive correlation between the proportion of Mexican American Indians and poverty level among single mothers in the United States with a correlation coefficient (R) of 0.695 and weighted average of 31.9%, a difference of 1.8%.
Single Mother Poverty Correlation Summary
| Measurement | Immigrants from Dominica | Mexican American Indian |
| Minimum | 4.9% | 26.5% |
| Maximum | 73.5% | 100.0% |
| Range | 68.7% | 73.5% |
| Mean | 31.7% | 46.8% |
| Median | 32.8% | 41.0% |
| Interquartile 25% (IQ1) | 24.6% | 32.8% |
| Interquartile 75% (IQ3) | 38.3% | 56.6% |
| Interquartile Range (IQR) | 13.7% | 23.8% |
| Standard Deviation (Sample) | 12.0% | 17.2% |
| Standard Deviation (Population) | 11.9% | 17.0% |
Demographics Similar to Immigrants from Dominica and Mexican American Indians by Single Mother Poverty
In terms of single mother poverty, the demographic groups most similar to Immigrants from Dominica are Yup'ik (32.5%, a difference of 0.13%), Immigrants from Latin America (32.4%, a difference of 0.20%), Somali (32.6%, a difference of 0.23%), U.S. Virgin Islander (32.6%, a difference of 0.25%), and Indonesian (32.4%, a difference of 0.31%). Similarly, the demographic groups most similar to Mexican American Indians are Delaware (31.8%, a difference of 0.21%), Immigrants from Zaire (32.0%, a difference of 0.22%), Central American (31.8%, a difference of 0.37%), Bangladeshi (31.7%, a difference of 0.56%), and Marshallese (32.1%, a difference of 0.63%).
| Demographics | Rating | Rank | Single Mother Poverty |
| Immigrants | Micronesia | 0.1 /100 | #272 | Tragic 31.6% |
| Fijians | 0.1 /100 | #273 | Tragic 31.6% |
| Bangladeshis | 0.1 /100 | #274 | Tragic 31.7% |
| Central Americans | 0.1 /100 | #275 | Tragic 31.8% |
| Delaware | 0.0 /100 | #276 | Tragic 31.8% |
| Mexican American Indians | 0.0 /100 | #277 | Tragic 31.9% |
| Immigrants | Zaire | 0.0 /100 | #278 | Tragic 32.0% |
| Marshallese | 0.0 /100 | #279 | Tragic 32.1% |
| Immigrants | Nonimmigrants | 0.0 /100 | #280 | Tragic 32.2% |
| Cree | 0.0 /100 | #281 | Tragic 32.2% |
| Immigrants | Azores | 0.0 /100 | #282 | Tragic 32.2% |
| Spanish Americans | 0.0 /100 | #283 | Tragic 32.3% |
| Indonesians | 0.0 /100 | #284 | Tragic 32.4% |
| Immigrants | Latin America | 0.0 /100 | #285 | Tragic 32.4% |
| Yup'ik | 0.0 /100 | #286 | Tragic 32.5% |
| Immigrants | Dominica | 0.0 /100 | #287 | Tragic 32.5% |
| Somalis | 0.0 /100 | #288 | Tragic 32.6% |
| U.S. Virgin Islanders | 0.0 /100 | #289 | Tragic 32.6% |
| Osage | 0.0 /100 | #290 | Tragic 32.6% |
| Guatemalans | 0.0 /100 | #291 | Tragic 32.9% |
| Shoshone | 0.0 /100 | #292 | Tragic 32.9% |