Immigrants from Dominica vs Immigrants from Brazil Single Mother Poverty
COMPARE
Immigrants from Dominica
Immigrants from Brazil
Single Mother Poverty
Single Mother Poverty Comparison
Immigrants from Dominica
Immigrants from Brazil
32.5%
SINGLE MOTHER POVERTY
0.0/ 100
METRIC RATING
287th/ 347
METRIC RANK
27.9%
SINGLE MOTHER POVERTY
97.2/ 100
METRIC RATING
97th/ 347
METRIC RANK
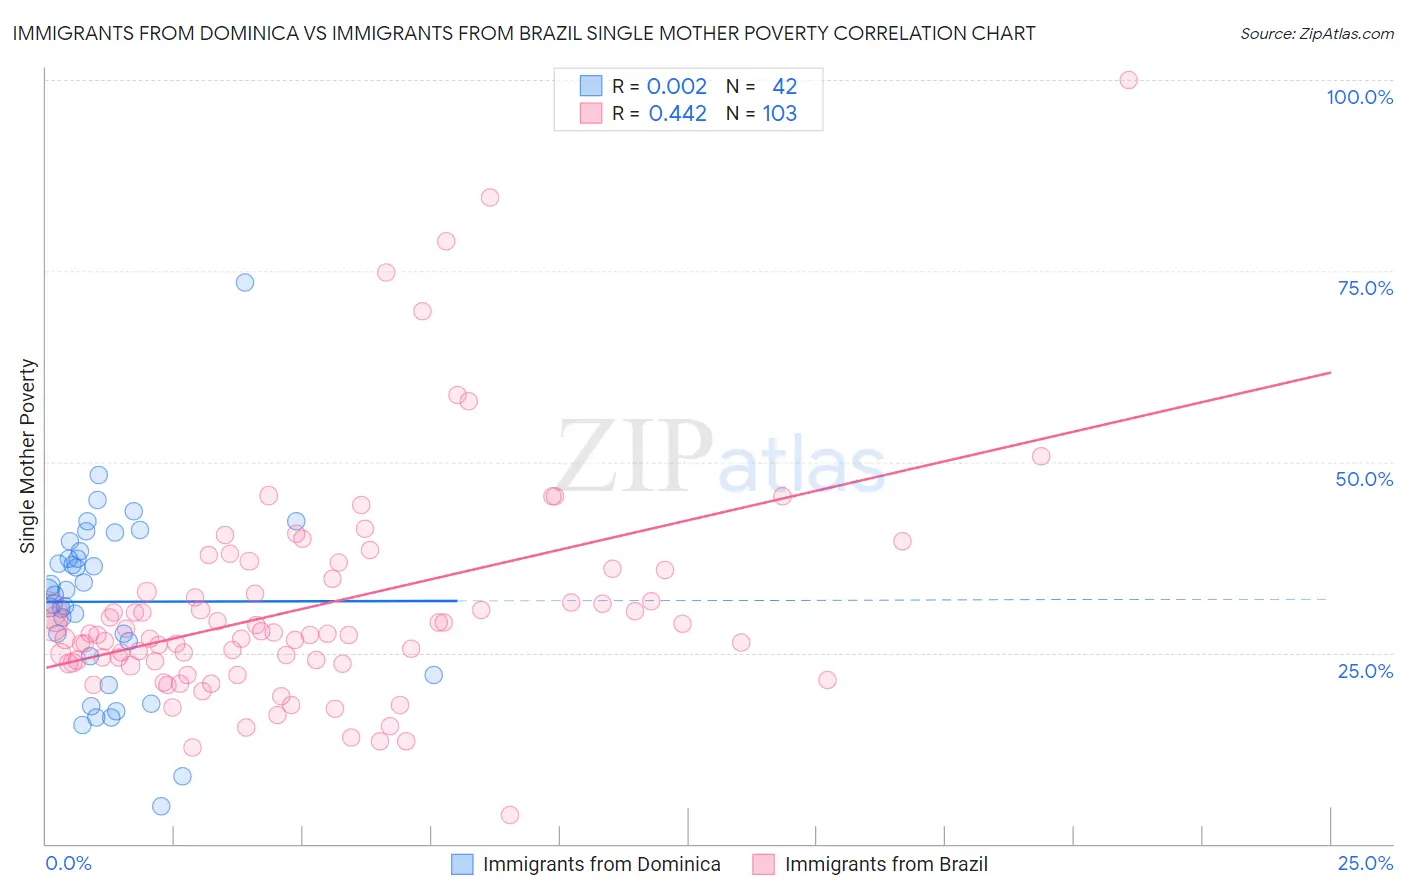
Immigrants from Dominica vs Immigrants from Brazil Single Mother Poverty Correlation Chart
The statistical analysis conducted on geographies consisting of 83,555,072 people shows no correlation between the proportion of Immigrants from Dominica and poverty level among single mothers in the United States with a correlation coefficient (R) of 0.002 and weighted average of 32.5%. Similarly, the statistical analysis conducted on geographies consisting of 334,860,150 people shows a moderate positive correlation between the proportion of Immigrants from Brazil and poverty level among single mothers in the United States with a correlation coefficient (R) of 0.442 and weighted average of 27.9%, a difference of 16.4%.
Single Mother Poverty Correlation Summary
| Measurement | Immigrants from Dominica | Immigrants from Brazil |
| Minimum | 4.9% | 3.8% |
| Maximum | 73.5% | 100.0% |
| Range | 68.7% | 96.2% |
| Mean | 31.7% | 31.0% |
| Median | 32.8% | 27.5% |
| Interquartile 25% (IQ1) | 24.6% | 23.7% |
| Interquartile 75% (IQ3) | 38.3% | 34.7% |
| Interquartile Range (IQR) | 13.7% | 11.1% |
| Standard Deviation (Sample) | 12.0% | 14.8% |
| Standard Deviation (Population) | 11.9% | 14.7% |
Similar Demographics by Single Mother Poverty
Demographics Similar to Immigrants from Dominica by Single Mother Poverty
In terms of single mother poverty, the demographic groups most similar to Immigrants from Dominica are Yup'ik (32.5%, a difference of 0.13%), Immigrants from Latin America (32.4%, a difference of 0.20%), Somali (32.6%, a difference of 0.23%), U.S. Virgin Islander (32.6%, a difference of 0.25%), and Indonesian (32.4%, a difference of 0.31%).
| Demographics | Rating | Rank | Single Mother Poverty |
| Immigrants | Nonimmigrants | 0.0 /100 | #280 | Tragic 32.2% |
| Cree | 0.0 /100 | #281 | Tragic 32.2% |
| Immigrants | Azores | 0.0 /100 | #282 | Tragic 32.2% |
| Spanish Americans | 0.0 /100 | #283 | Tragic 32.3% |
| Indonesians | 0.0 /100 | #284 | Tragic 32.4% |
| Immigrants | Latin America | 0.0 /100 | #285 | Tragic 32.4% |
| Yup'ik | 0.0 /100 | #286 | Tragic 32.5% |
| Immigrants | Dominica | 0.0 /100 | #287 | Tragic 32.5% |
| Somalis | 0.0 /100 | #288 | Tragic 32.6% |
| U.S. Virgin Islanders | 0.0 /100 | #289 | Tragic 32.6% |
| Osage | 0.0 /100 | #290 | Tragic 32.6% |
| Guatemalans | 0.0 /100 | #291 | Tragic 32.9% |
| Shoshone | 0.0 /100 | #292 | Tragic 32.9% |
| Aleuts | 0.0 /100 | #293 | Tragic 32.9% |
| French American Indians | 0.0 /100 | #294 | Tragic 33.1% |
Demographics Similar to Immigrants from Brazil by Single Mother Poverty
In terms of single mother poverty, the demographic groups most similar to Immigrants from Brazil are Immigrants from Nepal (27.9%, a difference of 0.010%), Immigrants from Netherlands (27.9%, a difference of 0.020%), Immigrants from Iraq (27.9%, a difference of 0.040%), Zimbabwean (27.9%, a difference of 0.070%), and Pakistani (28.0%, a difference of 0.13%).
| Demographics | Rating | Rank | Single Mother Poverty |
| Immigrants | France | 98.2 /100 | #90 | Exceptional 27.8% |
| Immigrants | Albania | 98.0 /100 | #91 | Exceptional 27.8% |
| Estonians | 97.9 /100 | #92 | Exceptional 27.8% |
| Romanians | 97.8 /100 | #93 | Exceptional 27.8% |
| Albanians | 97.6 /100 | #94 | Exceptional 27.9% |
| Chileans | 97.5 /100 | #95 | Exceptional 27.9% |
| Immigrants | Iraq | 97.3 /100 | #96 | Exceptional 27.9% |
| Immigrants | Brazil | 97.2 /100 | #97 | Exceptional 27.9% |
| Immigrants | Nepal | 97.2 /100 | #98 | Exceptional 27.9% |
| Immigrants | Netherlands | 97.2 /100 | #99 | Exceptional 27.9% |
| Zimbabweans | 97.1 /100 | #100 | Exceptional 27.9% |
| Pakistanis | 96.9 /100 | #101 | Exceptional 28.0% |
| Immigrants | Croatia | 96.7 /100 | #102 | Exceptional 28.0% |
| Immigrants | Northern Africa | 96.6 /100 | #103 | Exceptional 28.0% |
| Italians | 96.6 /100 | #104 | Exceptional 28.0% |