Immigrants from Denmark vs Alaska Native Divorced or Separated
COMPARE
Immigrants from Denmark
Alaska Native
Divorced or Separated
Divorced or Separated Comparison
Immigrants from Denmark
Alaska Natives
11.6%
DIVORCED OR SEPARATED
98.9/ 100
METRIC RATING
92nd/ 347
METRIC RANK
12.4%
DIVORCED OR SEPARATED
2.5/ 100
METRIC RATING
244th/ 347
METRIC RANK
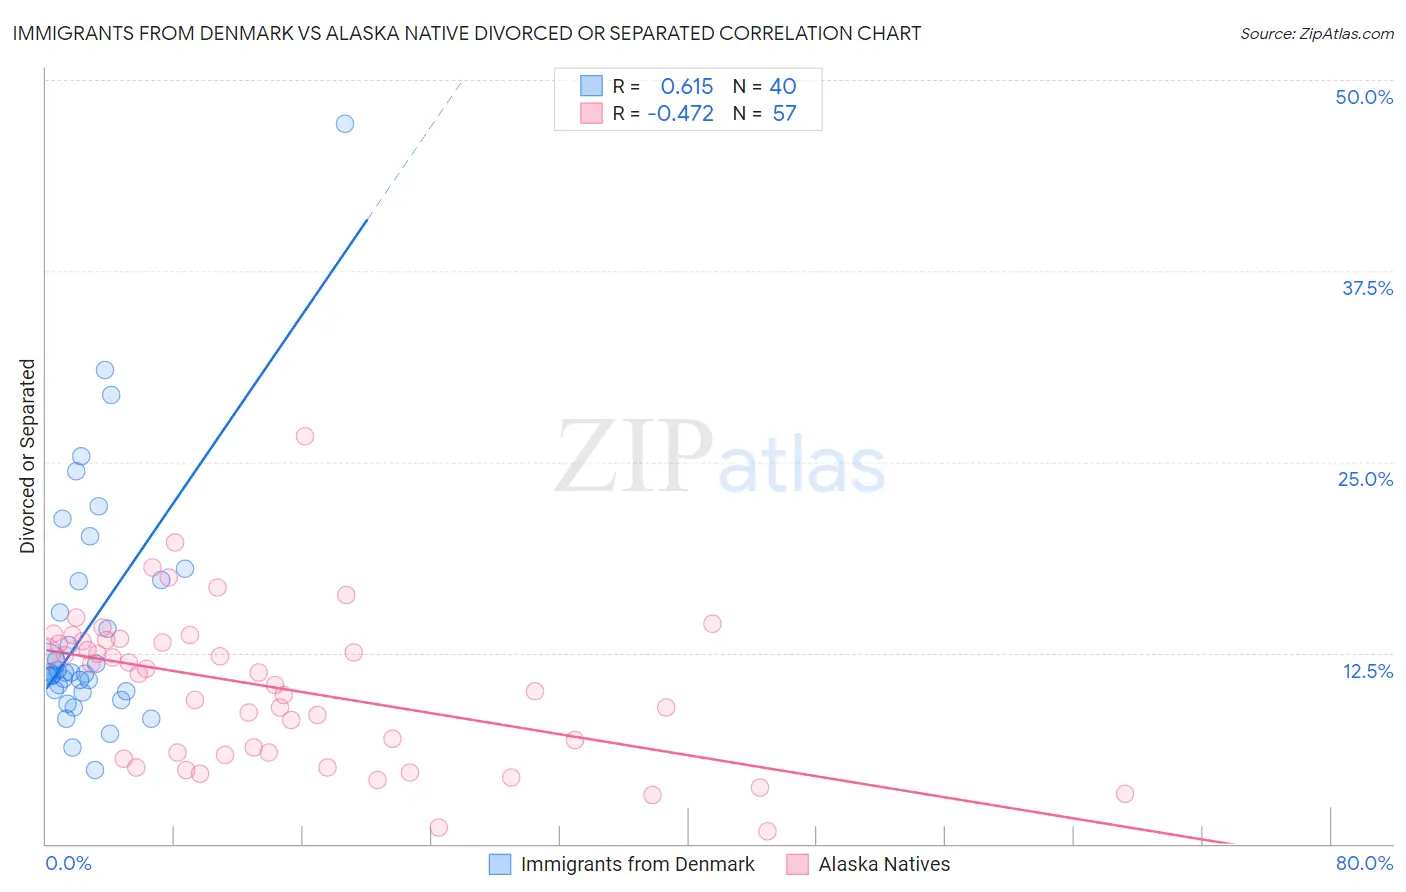
Immigrants from Denmark vs Alaska Native Divorced or Separated Correlation Chart
The statistical analysis conducted on geographies consisting of 136,412,843 people shows a significant positive correlation between the proportion of Immigrants from Denmark and percentage of population currently divorced or separated in the United States with a correlation coefficient (R) of 0.615 and weighted average of 11.6%. Similarly, the statistical analysis conducted on geographies consisting of 76,749,799 people shows a moderate negative correlation between the proportion of Alaska Natives and percentage of population currently divorced or separated in the United States with a correlation coefficient (R) of -0.472 and weighted average of 12.4%, a difference of 7.3%.
Divorced or Separated Correlation Summary
| Measurement | Immigrants from Denmark | Alaska Native |
| Minimum | 4.8% | 0.80% |
| Maximum | 47.1% | 26.7% |
| Range | 42.3% | 25.9% |
| Mean | 14.4% | 10.2% |
| Median | 11.2% | 11.1% |
| Interquartile 25% (IQ1) | 10.0% | 5.9% |
| Interquartile 75% (IQ3) | 17.2% | 13.3% |
| Interquartile Range (IQR) | 7.2% | 7.4% |
| Standard Deviation (Sample) | 8.1% | 5.0% |
| Standard Deviation (Population) | 8.0% | 4.9% |
Similar Demographics by Divorced or Separated
Demographics Similar to Immigrants from Denmark by Divorced or Separated
In terms of divorced or separated, the demographic groups most similar to Immigrants from Denmark are Arab (11.6%, a difference of 0.0%), Immigrants from Fiji (11.6%, a difference of 0.010%), Spanish American Indian (11.6%, a difference of 0.060%), Zimbabwean (11.6%, a difference of 0.10%), and Immigrants from Serbia (11.6%, a difference of 0.11%).
| Demographics | Rating | Rank | Divorced or Separated |
| Immigrants | Albania | 99.3 /100 | #85 | Exceptional 11.5% |
| Immigrants | Latvia | 99.2 /100 | #86 | Exceptional 11.6% |
| Immigrants | Nepal | 99.2 /100 | #87 | Exceptional 11.6% |
| Immigrants | Europe | 99.2 /100 | #88 | Exceptional 11.6% |
| Immigrants | Southern Europe | 99.1 /100 | #89 | Exceptional 11.6% |
| Zimbabweans | 99.0 /100 | #90 | Exceptional 11.6% |
| Spanish American Indians | 99.0 /100 | #91 | Exceptional 11.6% |
| Immigrants | Denmark | 98.9 /100 | #92 | Exceptional 11.6% |
| Arabs | 98.9 /100 | #93 | Exceptional 11.6% |
| Immigrants | Fiji | 98.9 /100 | #94 | Exceptional 11.6% |
| Immigrants | Serbia | 98.8 /100 | #95 | Exceptional 11.6% |
| Immigrants | Ukraine | 98.7 /100 | #96 | Exceptional 11.6% |
| Latvians | 98.7 /100 | #97 | Exceptional 11.6% |
| Immigrants | Jordan | 98.6 /100 | #98 | Exceptional 11.6% |
| Immigrants | Sweden | 98.6 /100 | #99 | Exceptional 11.6% |
Demographics Similar to Alaska Natives by Divorced or Separated
In terms of divorced or separated, the demographic groups most similar to Alaska Natives are Immigrants from Latin America (12.4%, a difference of 0.10%), Dutch (12.4%, a difference of 0.17%), Hispanic or Latino (12.5%, a difference of 0.22%), Immigrants from West Indies (12.5%, a difference of 0.24%), and Uruguayan (12.4%, a difference of 0.25%).
| Demographics | Rating | Rank | Divorced or Separated |
| Immigrants | Laos | 4.2 /100 | #237 | Tragic 12.4% |
| Sudanese | 4.0 /100 | #238 | Tragic 12.4% |
| Immigrants | Germany | 4.0 /100 | #239 | Tragic 12.4% |
| British West Indians | 3.7 /100 | #240 | Tragic 12.4% |
| Uruguayans | 3.4 /100 | #241 | Tragic 12.4% |
| Dutch | 3.1 /100 | #242 | Tragic 12.4% |
| Immigrants | Latin America | 2.8 /100 | #243 | Tragic 12.4% |
| Alaska Natives | 2.5 /100 | #244 | Tragic 12.4% |
| Hispanics or Latinos | 2.0 /100 | #245 | Tragic 12.5% |
| Immigrants | West Indies | 1.9 /100 | #246 | Tragic 12.5% |
| Germans | 1.8 /100 | #247 | Tragic 12.5% |
| Nepalese | 1.8 /100 | #248 | Tragic 12.5% |
| Finns | 1.8 /100 | #249 | Tragic 12.5% |
| Irish | 1.3 /100 | #250 | Tragic 12.5% |
| Aleuts | 1.3 /100 | #251 | Tragic 12.5% |