Liberian vs Hungarian Male Poverty
COMPARE
Liberian
Hungarian
Male Poverty
Male Poverty Comparison
Liberians
Hungarians
12.8%
MALE POVERTY
0.3/ 100
METRIC RATING
245th/ 347
METRIC RANK
11.1%
MALE POVERTY
55.1/ 100
METRIC RATING
167th/ 347
METRIC RANK
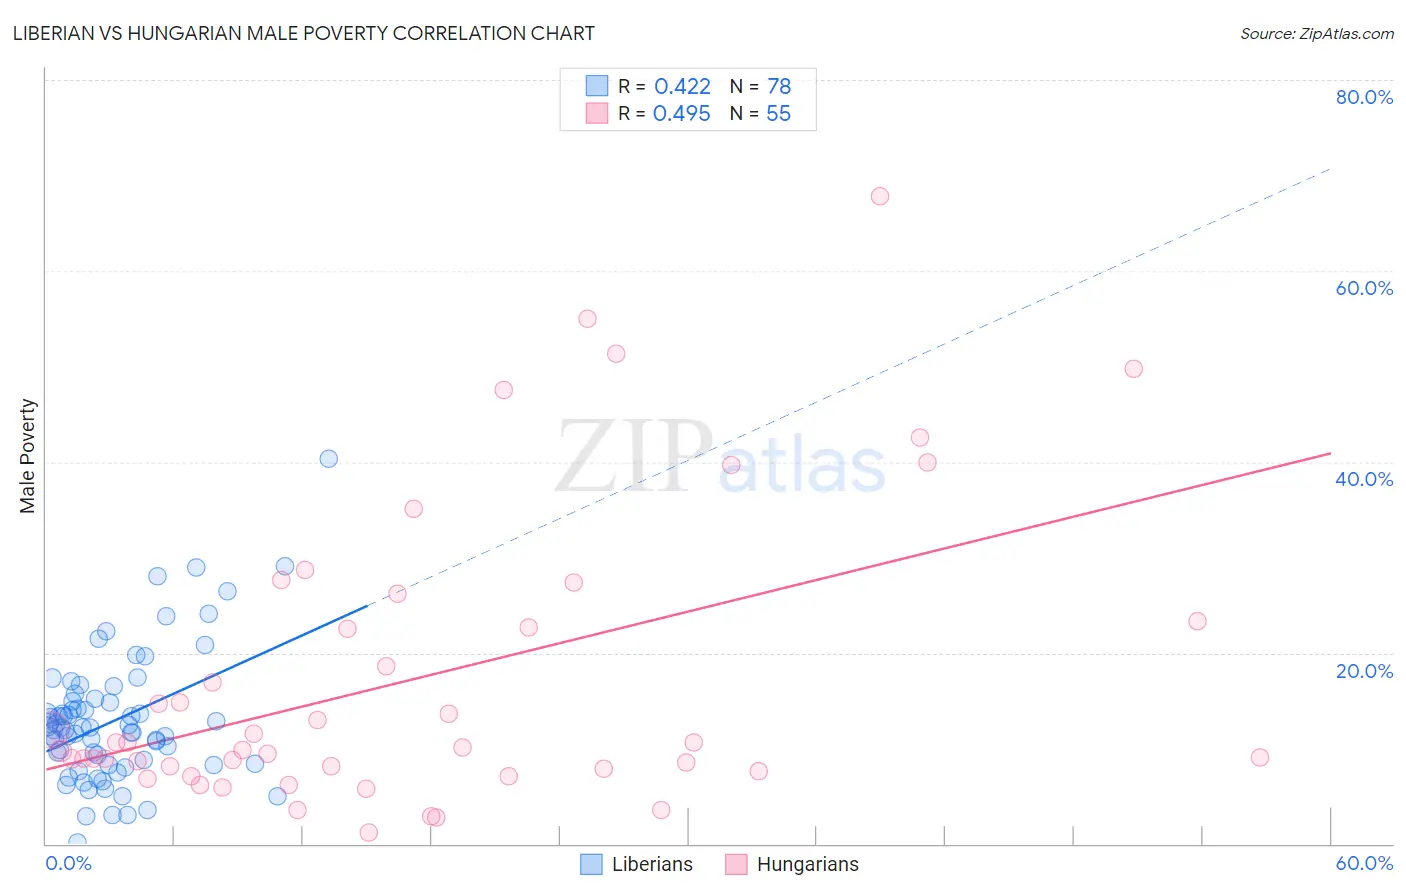
Liberian vs Hungarian Male Poverty Correlation Chart
The statistical analysis conducted on geographies consisting of 118,033,924 people shows a moderate positive correlation between the proportion of Liberians and poverty level among males in the United States with a correlation coefficient (R) of 0.422 and weighted average of 12.8%. Similarly, the statistical analysis conducted on geographies consisting of 485,483,073 people shows a moderate positive correlation between the proportion of Hungarians and poverty level among males in the United States with a correlation coefficient (R) of 0.495 and weighted average of 11.1%, a difference of 15.0%.
Male Poverty Correlation Summary
| Measurement | Liberian | Hungarian |
| Minimum | 0.17% | 1.2% |
| Maximum | 40.3% | 67.8% |
| Range | 40.1% | 66.6% |
| Mean | 12.9% | 17.3% |
| Median | 12.1% | 10.1% |
| Interquartile 25% (IQ1) | 8.4% | 7.8% |
| Interquartile 75% (IQ3) | 15.0% | 23.3% |
| Interquartile Range (IQR) | 6.6% | 15.4% |
| Standard Deviation (Sample) | 6.8% | 15.4% |
| Standard Deviation (Population) | 6.8% | 15.3% |
Similar Demographics by Male Poverty
Demographics Similar to Liberians by Male Poverty
In terms of male poverty, the demographic groups most similar to Liberians are Tsimshian (12.8%, a difference of 0.010%), Alaskan Athabascan (12.8%, a difference of 0.12%), Nepalese (12.8%, a difference of 0.16%), Immigrants from El Salvador (12.8%, a difference of 0.30%), and Sudanese (12.8%, a difference of 0.32%).
| Demographics | Rating | Rank | Male Poverty |
| Ecuadorians | 0.4 /100 | #238 | Tragic 12.7% |
| Ghanaians | 0.4 /100 | #239 | Tragic 12.7% |
| Immigrants | Middle Africa | 0.4 /100 | #240 | Tragic 12.7% |
| Sudanese | 0.3 /100 | #241 | Tragic 12.8% |
| Nepalese | 0.3 /100 | #242 | Tragic 12.8% |
| Alaskan Athabascans | 0.3 /100 | #243 | Tragic 12.8% |
| Tsimshian | 0.3 /100 | #244 | Tragic 12.8% |
| Liberians | 0.3 /100 | #245 | Tragic 12.8% |
| Immigrants | El Salvador | 0.2 /100 | #246 | Tragic 12.8% |
| Immigrants | Western Africa | 0.2 /100 | #247 | Tragic 12.9% |
| Immigrants | Sudan | 0.2 /100 | #248 | Tragic 12.9% |
| Potawatomi | 0.2 /100 | #249 | Tragic 12.9% |
| Immigrants | Nicaragua | 0.2 /100 | #250 | Tragic 12.9% |
| Immigrants | Cuba | 0.2 /100 | #251 | Tragic 12.9% |
| Immigrants | Ecuador | 0.2 /100 | #252 | Tragic 12.9% |
Demographics Similar to Hungarians by Male Poverty
In terms of male poverty, the demographic groups most similar to Hungarians are Immigrants from Albania (11.1%, a difference of 0.020%), Immigrants from Portugal (11.1%, a difference of 0.020%), Immigrants from Spain (11.1%, a difference of 0.040%), Immigrants from Colombia (11.1%, a difference of 0.090%), and South American (11.1%, a difference of 0.14%).
| Demographics | Rating | Rank | Male Poverty |
| Soviet Union | 60.3 /100 | #160 | Good 11.1% |
| Immigrants | Northern Africa | 59.7 /100 | #161 | Average 11.1% |
| Immigrants | Chile | 57.4 /100 | #162 | Average 11.1% |
| Whites/Caucasians | 56.7 /100 | #163 | Average 11.1% |
| Ethiopians | 56.7 /100 | #164 | Average 11.1% |
| Immigrants | Spain | 55.5 /100 | #165 | Average 11.1% |
| Immigrants | Albania | 55.3 /100 | #166 | Average 11.1% |
| Hungarians | 55.1 /100 | #167 | Average 11.1% |
| Immigrants | Portugal | 54.9 /100 | #168 | Average 11.1% |
| Immigrants | Colombia | 54.2 /100 | #169 | Average 11.1% |
| South Americans | 53.8 /100 | #170 | Average 11.1% |
| Uruguayans | 51.0 /100 | #171 | Average 11.2% |
| Immigrants | Ethiopia | 50.7 /100 | #172 | Average 11.2% |
| Pennsylvania Germans | 50.5 /100 | #173 | Average 11.2% |
| Immigrants | Oceania | 50.0 /100 | #174 | Average 11.2% |