Immigrants from Cuba vs Irish Single Mother Poverty
COMPARE
Immigrants from Cuba
Irish
Single Mother Poverty
Single Mother Poverty Comparison
Immigrants from Cuba
Irish
30.1%
SINGLE MOTHER POVERTY
6.9/ 100
METRIC RATING
223rd/ 347
METRIC RANK
29.8%
SINGLE MOTHER POVERTY
13.9/ 100
METRIC RATING
209th/ 347
METRIC RANK
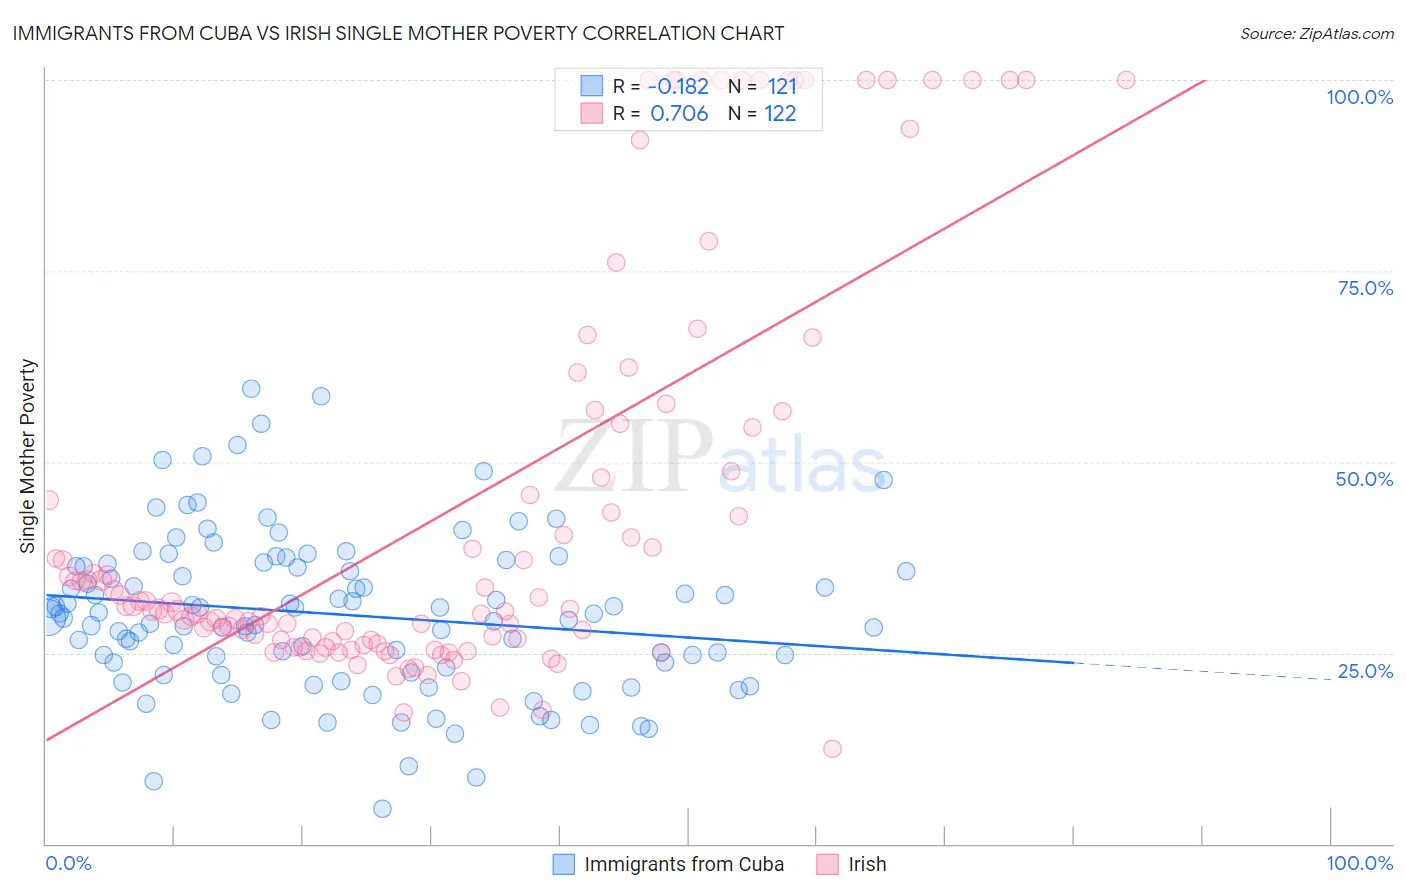
Immigrants from Cuba vs Irish Single Mother Poverty Correlation Chart
The statistical analysis conducted on geographies consisting of 320,148,902 people shows a poor negative correlation between the proportion of Immigrants from Cuba and poverty level among single mothers in the United States with a correlation coefficient (R) of -0.182 and weighted average of 30.1%. Similarly, the statistical analysis conducted on geographies consisting of 549,467,184 people shows a strong positive correlation between the proportion of Irish and poverty level among single mothers in the United States with a correlation coefficient (R) of 0.706 and weighted average of 29.8%, a difference of 0.92%.
Single Mother Poverty Correlation Summary
| Measurement | Immigrants from Cuba | Irish |
| Minimum | 4.7% | 12.4% |
| Maximum | 59.5% | 100.0% |
| Range | 54.9% | 87.6% |
| Mean | 30.0% | 43.8% |
| Median | 29.6% | 30.8% |
| Interquartile 25% (IQ1) | 23.4% | 26.6% |
| Interquartile 75% (IQ3) | 36.4% | 54.5% |
| Interquartile Range (IQR) | 13.0% | 28.0% |
| Standard Deviation (Sample) | 10.3% | 26.6% |
| Standard Deviation (Population) | 10.2% | 26.5% |
Demographics Similar to Immigrants from Cuba and Irish by Single Mother Poverty
In terms of single mother poverty, the demographic groups most similar to Immigrants from Cuba are Immigrants from Sudan (30.1%, a difference of 0.070%), Spanish (30.1%, a difference of 0.10%), Sudanese (30.0%, a difference of 0.13%), Immigrants from Eritrea (30.0%, a difference of 0.14%), and Scottish (30.1%, a difference of 0.16%). Similarly, the demographic groups most similar to Irish are Haitian (29.8%, a difference of 0.060%), Immigrants from Guyana (29.8%, a difference of 0.080%), Guyanese (29.8%, a difference of 0.11%), Immigrants from Panama (29.8%, a difference of 0.15%), and Nicaraguan (29.8%, a difference of 0.15%).
| Demographics | Rating | Rank | Single Mother Poverty |
| Immigrants | Haiti | 15.8 /100 | #206 | Poor 29.7% |
| Immigrants | Panama | 15.5 /100 | #207 | Poor 29.8% |
| Immigrants | Guyana | 14.7 /100 | #208 | Poor 29.8% |
| Irish | 13.9 /100 | #209 | Poor 29.8% |
| Haitians | 13.3 /100 | #210 | Poor 29.8% |
| Guyanese | 12.8 /100 | #211 | Poor 29.8% |
| Nicaraguans | 12.4 /100 | #212 | Poor 29.8% |
| Immigrants | Thailand | 12.0 /100 | #213 | Poor 29.9% |
| Liberians | 11.7 /100 | #214 | Poor 29.9% |
| Jamaicans | 11.7 /100 | #215 | Poor 29.9% |
| Immigrants | Western Africa | 11.5 /100 | #216 | Poor 29.9% |
| Immigrants | Ghana | 11.3 /100 | #217 | Poor 29.9% |
| Hungarians | 10.3 /100 | #218 | Poor 29.9% |
| Finns | 9.3 /100 | #219 | Tragic 30.0% |
| Germans | 8.8 /100 | #220 | Tragic 30.0% |
| Immigrants | Eritrea | 7.7 /100 | #221 | Tragic 30.0% |
| Sudanese | 7.6 /100 | #222 | Tragic 30.0% |
| Immigrants | Cuba | 6.9 /100 | #223 | Tragic 30.1% |
| Immigrants | Sudan | 6.5 /100 | #224 | Tragic 30.1% |
| Spanish | 6.3 /100 | #225 | Tragic 30.1% |
| Scottish | 6.0 /100 | #226 | Tragic 30.1% |