Immigrants from Cuba vs Kiowa Child Poverty Among Girls Under 16
COMPARE
Immigrants from Cuba
Kiowa
Child Poverty Among Girls Under 16
Child Poverty Among Girls Under 16 Comparison
Immigrants from Cuba
Kiowa
18.8%
CHILD POVERTY AMONG GIRLS UNDER 16
0.7/ 100
METRIC RATING
242nd/ 347
METRIC RANK
23.7%
CHILD POVERTY AMONG GIRLS UNDER 16
0.0/ 100
METRIC RATING
329th/ 347
METRIC RANK
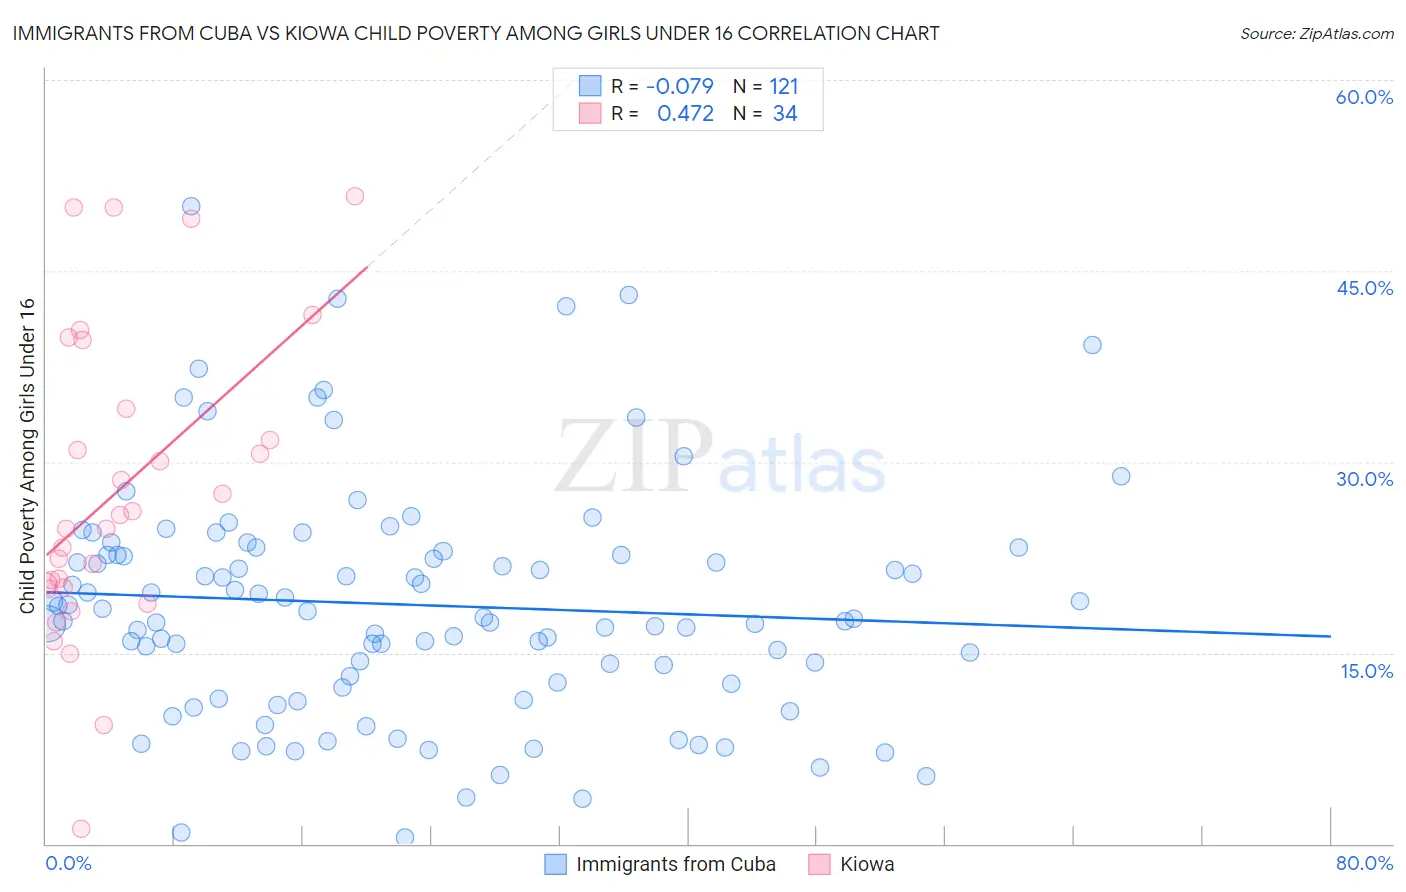
Immigrants from Cuba vs Kiowa Child Poverty Among Girls Under 16 Correlation Chart
The statistical analysis conducted on geographies consisting of 321,897,720 people shows a slight negative correlation between the proportion of Immigrants from Cuba and poverty level among girls under the age of 16 in the United States with a correlation coefficient (R) of -0.079 and weighted average of 18.8%. Similarly, the statistical analysis conducted on geographies consisting of 55,981,337 people shows a moderate positive correlation between the proportion of Kiowa and poverty level among girls under the age of 16 in the United States with a correlation coefficient (R) of 0.472 and weighted average of 23.7%, a difference of 26.1%.
Child Poverty Among Girls Under 16 Correlation Summary
| Measurement | Immigrants from Cuba | Kiowa |
| Minimum | 0.48% | 1.2% |
| Maximum | 50.1% | 50.8% |
| Range | 49.6% | 49.7% |
| Mean | 18.8% | 27.7% |
| Median | 17.8% | 25.3% |
| Interquartile 25% (IQ1) | 12.6% | 20.1% |
| Interquartile 75% (IQ3) | 22.9% | 34.2% |
| Interquartile Range (IQR) | 10.2% | 14.1% |
| Standard Deviation (Sample) | 9.2% | 11.9% |
| Standard Deviation (Population) | 9.1% | 11.8% |
Similar Demographics by Child Poverty Among Girls Under 16
Demographics Similar to Immigrants from Cuba by Child Poverty Among Girls Under 16
In terms of child poverty among girls under 16, the demographic groups most similar to Immigrants from Cuba are American (18.8%, a difference of 0.14%), Immigrants from Nicaragua (18.8%, a difference of 0.22%), Ecuadorian (18.8%, a difference of 0.28%), Shoshone (18.9%, a difference of 0.40%), and Immigrants from Laos (18.9%, a difference of 0.43%).
| Demographics | Rating | Rank | Child Poverty Among Girls Under 16 |
| Nepalese | 1.1 /100 | #235 | Tragic 18.6% |
| Alsatians | 1.1 /100 | #236 | Tragic 18.6% |
| Immigrants | Nigeria | 1.0 /100 | #237 | Tragic 18.6% |
| Immigrants | Eritrea | 1.0 /100 | #238 | Tragic 18.7% |
| Marshallese | 0.9 /100 | #239 | Tragic 18.7% |
| Nigerians | 0.9 /100 | #240 | Tragic 18.7% |
| Americans | 0.8 /100 | #241 | Tragic 18.8% |
| Immigrants | Cuba | 0.7 /100 | #242 | Tragic 18.8% |
| Immigrants | Nicaragua | 0.7 /100 | #243 | Tragic 18.8% |
| Ecuadorians | 0.7 /100 | #244 | Tragic 18.8% |
| Shoshone | 0.6 /100 | #245 | Tragic 18.9% |
| Immigrants | Laos | 0.6 /100 | #246 | Tragic 18.9% |
| Immigrants | Ghana | 0.5 /100 | #247 | Tragic 18.9% |
| French American Indians | 0.3 /100 | #248 | Tragic 19.2% |
| Potawatomi | 0.3 /100 | #249 | Tragic 19.2% |
Demographics Similar to Kiowa by Child Poverty Among Girls Under 16
In terms of child poverty among girls under 16, the demographic groups most similar to Kiowa are Dominican (23.7%, a difference of 0.12%), Immigrants from Dominican Republic (23.8%, a difference of 0.54%), Apache (23.8%, a difference of 0.58%), Native/Alaskan (24.0%, a difference of 1.5%), and Central American Indian (22.8%, a difference of 3.9%).
| Demographics | Rating | Rank | Child Poverty Among Girls Under 16 |
| Yakama | 0.0 /100 | #322 | Tragic 22.6% |
| Cajuns | 0.0 /100 | #323 | Tragic 22.6% |
| Paiute | 0.0 /100 | #324 | Tragic 22.6% |
| Immigrants | Congo | 0.0 /100 | #325 | Tragic 22.7% |
| Immigrants | Honduras | 0.0 /100 | #326 | Tragic 22.8% |
| Central American Indians | 0.0 /100 | #327 | Tragic 22.8% |
| Dominicans | 0.0 /100 | #328 | Tragic 23.7% |
| Kiowa | 0.0 /100 | #329 | Tragic 23.7% |
| Immigrants | Dominican Republic | 0.0 /100 | #330 | Tragic 23.8% |
| Apache | 0.0 /100 | #331 | Tragic 23.8% |
| Natives/Alaskans | 0.0 /100 | #332 | Tragic 24.0% |
| Blacks/African Americans | 0.0 /100 | #333 | Tragic 24.7% |
| Menominee | 0.0 /100 | #334 | Tragic 25.0% |
| Pueblo | 0.0 /100 | #335 | Tragic 25.2% |
| Sioux | 0.0 /100 | #336 | Tragic 25.6% |