Immigrants from Cuba vs Indonesian Child Poverty Among Girls Under 16
COMPARE
Immigrants from Cuba
Indonesian
Child Poverty Among Girls Under 16
Child Poverty Among Girls Under 16 Comparison
Immigrants from Cuba
Indonesians
18.8%
CHILD POVERTY AMONG GIRLS UNDER 16
0.7/ 100
METRIC RATING
242nd/ 347
METRIC RANK
21.3%
CHILD POVERTY AMONG GIRLS UNDER 16
0.0/ 100
METRIC RATING
304th/ 347
METRIC RANK
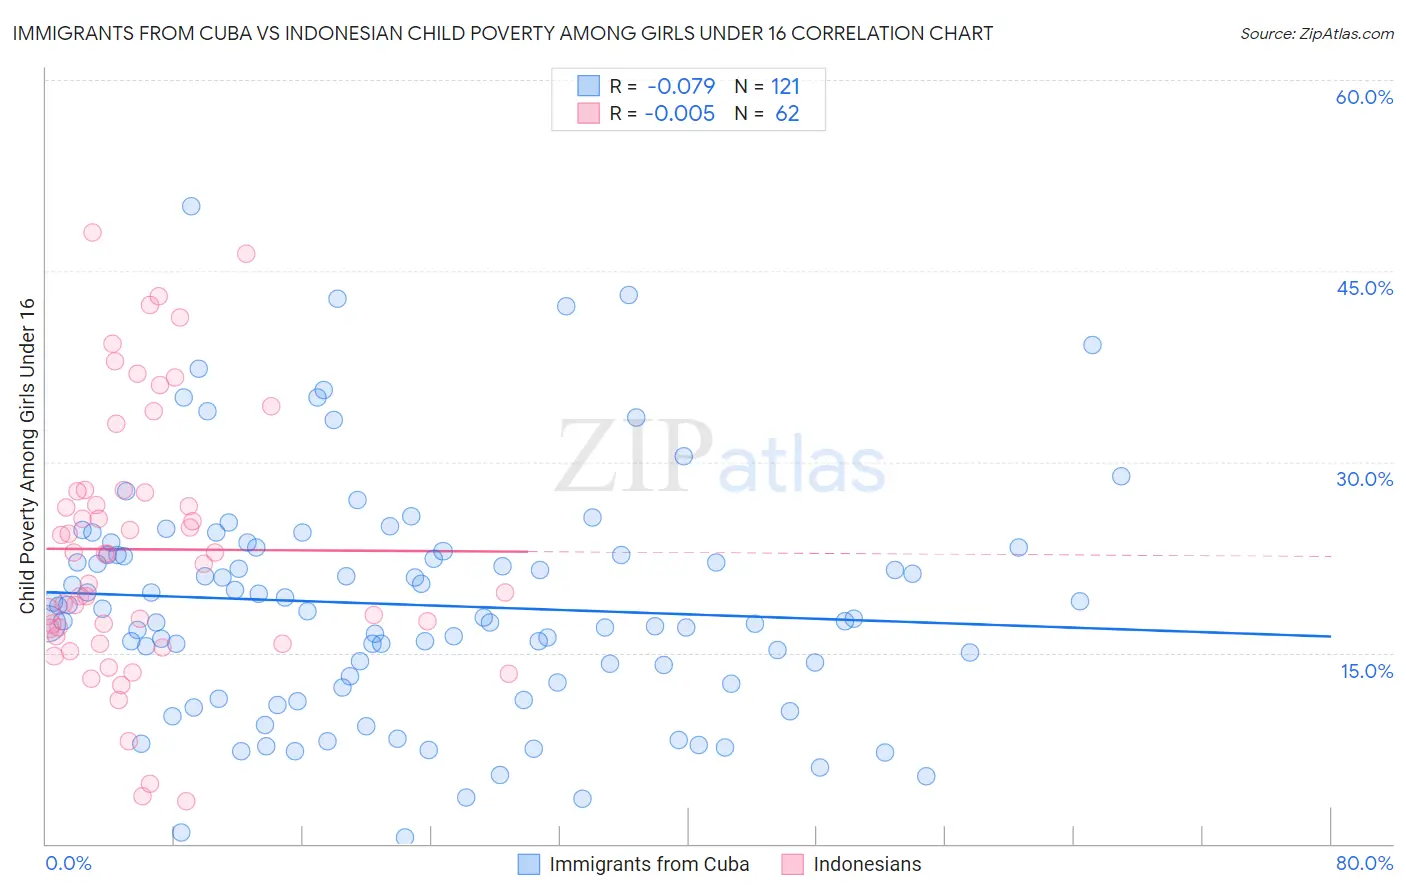
Immigrants from Cuba vs Indonesian Child Poverty Among Girls Under 16 Correlation Chart
The statistical analysis conducted on geographies consisting of 321,897,720 people shows a slight negative correlation between the proportion of Immigrants from Cuba and poverty level among girls under the age of 16 in the United States with a correlation coefficient (R) of -0.079 and weighted average of 18.8%. Similarly, the statistical analysis conducted on geographies consisting of 161,734,179 people shows no correlation between the proportion of Indonesians and poverty level among girls under the age of 16 in the United States with a correlation coefficient (R) of -0.005 and weighted average of 21.3%, a difference of 13.2%.
Child Poverty Among Girls Under 16 Correlation Summary
| Measurement | Immigrants from Cuba | Indonesian |
| Minimum | 0.48% | 3.3% |
| Maximum | 50.1% | 48.1% |
| Range | 49.6% | 44.8% |
| Mean | 18.8% | 23.1% |
| Median | 17.8% | 22.3% |
| Interquartile 25% (IQ1) | 12.6% | 16.3% |
| Interquartile 75% (IQ3) | 22.9% | 27.7% |
| Interquartile Range (IQR) | 10.2% | 11.3% |
| Standard Deviation (Sample) | 9.2% | 10.3% |
| Standard Deviation (Population) | 9.1% | 10.2% |
Similar Demographics by Child Poverty Among Girls Under 16
Demographics Similar to Immigrants from Cuba by Child Poverty Among Girls Under 16
In terms of child poverty among girls under 16, the demographic groups most similar to Immigrants from Cuba are American (18.8%, a difference of 0.14%), Immigrants from Nicaragua (18.8%, a difference of 0.22%), Ecuadorian (18.8%, a difference of 0.28%), Shoshone (18.9%, a difference of 0.40%), and Immigrants from Laos (18.9%, a difference of 0.43%).
| Demographics | Rating | Rank | Child Poverty Among Girls Under 16 |
| Nepalese | 1.1 /100 | #235 | Tragic 18.6% |
| Alsatians | 1.1 /100 | #236 | Tragic 18.6% |
| Immigrants | Nigeria | 1.0 /100 | #237 | Tragic 18.6% |
| Immigrants | Eritrea | 1.0 /100 | #238 | Tragic 18.7% |
| Marshallese | 0.9 /100 | #239 | Tragic 18.7% |
| Nigerians | 0.9 /100 | #240 | Tragic 18.7% |
| Americans | 0.8 /100 | #241 | Tragic 18.8% |
| Immigrants | Cuba | 0.7 /100 | #242 | Tragic 18.8% |
| Immigrants | Nicaragua | 0.7 /100 | #243 | Tragic 18.8% |
| Ecuadorians | 0.7 /100 | #244 | Tragic 18.8% |
| Shoshone | 0.6 /100 | #245 | Tragic 18.9% |
| Immigrants | Laos | 0.6 /100 | #246 | Tragic 18.9% |
| Immigrants | Ghana | 0.5 /100 | #247 | Tragic 18.9% |
| French American Indians | 0.3 /100 | #248 | Tragic 19.2% |
| Potawatomi | 0.3 /100 | #249 | Tragic 19.2% |
Demographics Similar to Indonesians by Child Poverty Among Girls Under 16
In terms of child poverty among girls under 16, the demographic groups most similar to Indonesians are British West Indian (21.3%, a difference of 0.030%), Seminole (21.2%, a difference of 0.48%), Choctaw (21.1%, a difference of 0.60%), Guatemalan (21.4%, a difference of 0.62%), and Immigrants from Central America (21.4%, a difference of 0.79%).
| Demographics | Rating | Rank | Child Poverty Among Girls Under 16 |
| Inupiat | 0.0 /100 | #297 | Tragic 20.8% |
| Mexicans | 0.0 /100 | #298 | Tragic 20.9% |
| Hispanics or Latinos | 0.0 /100 | #299 | Tragic 21.0% |
| Somalis | 0.0 /100 | #300 | Tragic 21.0% |
| Choctaw | 0.0 /100 | #301 | Tragic 21.1% |
| Seminole | 0.0 /100 | #302 | Tragic 21.2% |
| British West Indians | 0.0 /100 | #303 | Tragic 21.3% |
| Indonesians | 0.0 /100 | #304 | Tragic 21.3% |
| Guatemalans | 0.0 /100 | #305 | Tragic 21.4% |
| Immigrants | Central America | 0.0 /100 | #306 | Tragic 21.4% |
| Immigrants | Bahamas | 0.0 /100 | #307 | Tragic 21.4% |
| Houma | 0.0 /100 | #308 | Tragic 21.5% |
| Bahamians | 0.0 /100 | #309 | Tragic 21.5% |
| Immigrants | Somalia | 0.0 /100 | #310 | Tragic 21.6% |
| Dutch West Indians | 0.0 /100 | #311 | Tragic 21.6% |