Immigrants from Croatia vs Israeli Single Mother Poverty
COMPARE
Immigrants from Croatia
Israeli
Single Mother Poverty
Single Mother Poverty Comparison
Immigrants from Croatia
Israelis
28.0%
SINGLE MOTHER POVERTY
96.7/ 100
METRIC RATING
102nd/ 347
METRIC RANK
28.0%
SINGLE MOTHER POVERTY
96.5/ 100
METRIC RATING
105th/ 347
METRIC RANK
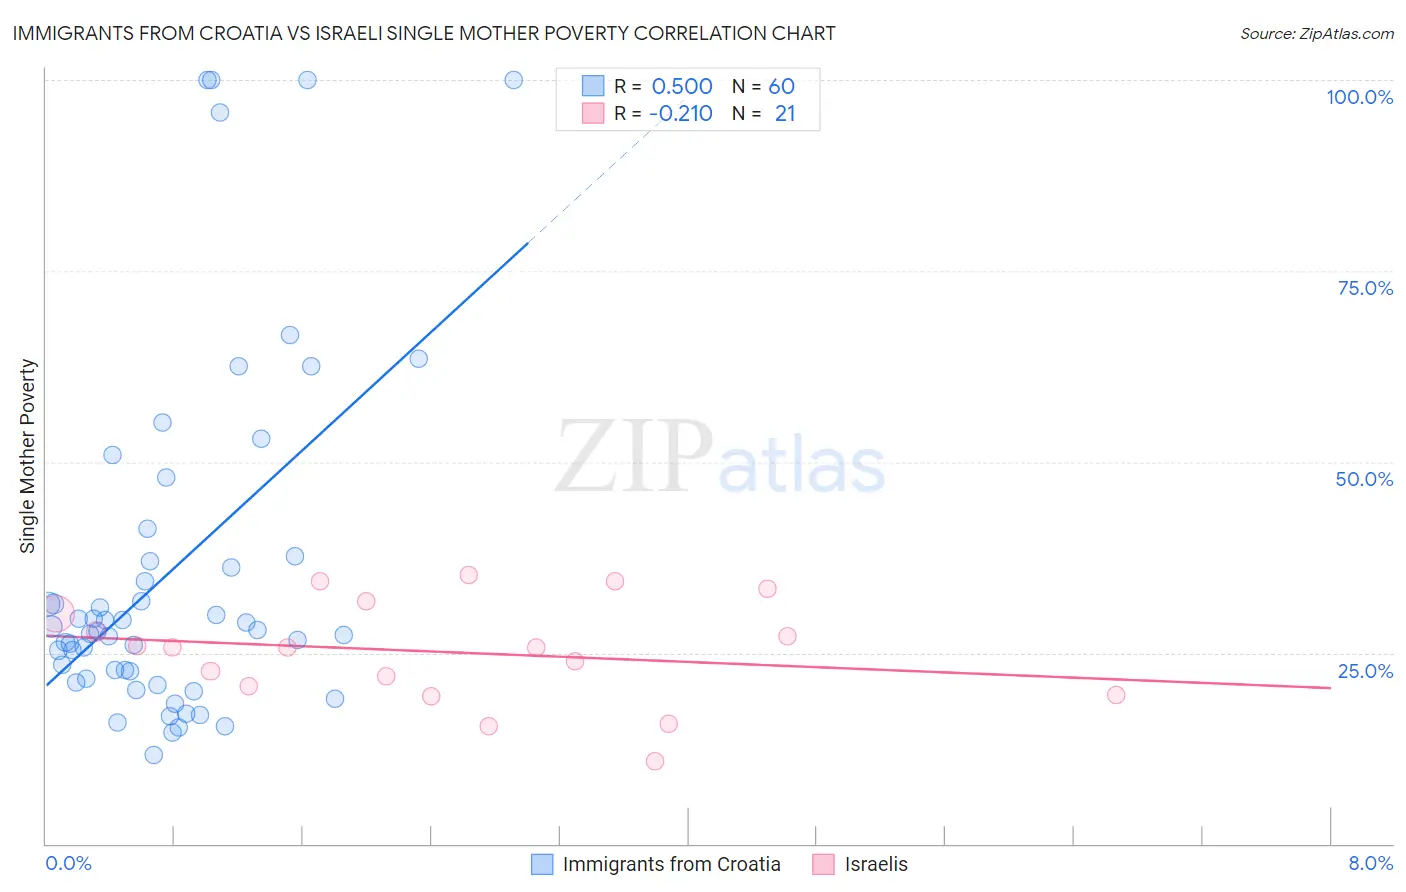
Immigrants from Croatia vs Israeli Single Mother Poverty Correlation Chart
The statistical analysis conducted on geographies consisting of 130,792,597 people shows a moderate positive correlation between the proportion of Immigrants from Croatia and poverty level among single mothers in the United States with a correlation coefficient (R) of 0.500 and weighted average of 28.0%. Similarly, the statistical analysis conducted on geographies consisting of 207,028,427 people shows a weak negative correlation between the proportion of Israelis and poverty level among single mothers in the United States with a correlation coefficient (R) of -0.210 and weighted average of 28.0%, a difference of 0.060%.
Single Mother Poverty Correlation Summary
| Measurement | Immigrants from Croatia | Israeli |
| Minimum | 11.6% | 10.8% |
| Maximum | 100.0% | 35.2% |
| Range | 88.4% | 24.4% |
| Mean | 35.8% | 25.1% |
| Median | 27.9% | 25.6% |
| Interquartile 25% (IQ1) | 22.2% | 20.1% |
| Interquartile 75% (IQ3) | 37.3% | 31.0% |
| Interquartile Range (IQR) | 15.1% | 10.9% |
| Standard Deviation (Sample) | 23.1% | 6.8% |
| Standard Deviation (Population) | 22.9% | 6.6% |
Demographics Similar to Immigrants from Croatia and Israelis by Single Mother Poverty
In terms of single mother poverty, the demographic groups most similar to Immigrants from Croatia are Immigrants from Northern Africa (28.0%, a difference of 0.020%), Italian (28.0%, a difference of 0.030%), Pakistani (28.0%, a difference of 0.10%), Ukrainian (28.0%, a difference of 0.10%), and Zimbabwean (27.9%, a difference of 0.17%). Similarly, the demographic groups most similar to Israelis are Italian (28.0%, a difference of 0.020%), Immigrants from Northern Africa (28.0%, a difference of 0.040%), Ukrainian (28.0%, a difference of 0.040%), Pakistani (28.0%, a difference of 0.16%), and Zimbabwean (27.9%, a difference of 0.23%).
| Demographics | Rating | Rank | Single Mother Poverty |
| Romanians | 97.8 /100 | #93 | Exceptional 27.8% |
| Albanians | 97.6 /100 | #94 | Exceptional 27.9% |
| Chileans | 97.5 /100 | #95 | Exceptional 27.9% |
| Immigrants | Iraq | 97.3 /100 | #96 | Exceptional 27.9% |
| Immigrants | Brazil | 97.2 /100 | #97 | Exceptional 27.9% |
| Immigrants | Nepal | 97.2 /100 | #98 | Exceptional 27.9% |
| Immigrants | Netherlands | 97.2 /100 | #99 | Exceptional 27.9% |
| Zimbabweans | 97.1 /100 | #100 | Exceptional 27.9% |
| Pakistanis | 96.9 /100 | #101 | Exceptional 28.0% |
| Immigrants | Croatia | 96.7 /100 | #102 | Exceptional 28.0% |
| Immigrants | Northern Africa | 96.6 /100 | #103 | Exceptional 28.0% |
| Italians | 96.6 /100 | #104 | Exceptional 28.0% |
| Israelis | 96.5 /100 | #105 | Exceptional 28.0% |
| Ukrainians | 96.4 /100 | #106 | Exceptional 28.0% |
| Immigrants | Venezuela | 95.8 /100 | #107 | Exceptional 28.1% |
| Immigrants | Zimbabwe | 95.5 /100 | #108 | Exceptional 28.1% |
| Immigrants | Armenia | 95.2 /100 | #109 | Exceptional 28.1% |
| Croatians | 94.8 /100 | #110 | Exceptional 28.2% |
| Venezuelans | 94.5 /100 | #111 | Exceptional 28.2% |
| Immigrants | Kazakhstan | 94.5 /100 | #112 | Exceptional 28.2% |
| Immigrants | South Africa | 93.2 /100 | #113 | Exceptional 28.3% |