Immigrants from Croatia vs Macedonian Unemployment Among Ages 16 to 19 years
COMPARE
Immigrants from Croatia
Macedonian
Unemployment Among Ages 16 to 19 years
Unemployment Among Ages 16 to 19 years Comparison
Immigrants from Croatia
Macedonians
17.3%
UNEMPLOYMENT AMONG AGES 16 TO 19 YEARS
80.8/ 100
METRIC RATING
140th/ 347
METRIC RANK
16.6%
UNEMPLOYMENT AMONG AGES 16 TO 19 YEARS
99.2/ 100
METRIC RATING
62nd/ 347
METRIC RANK
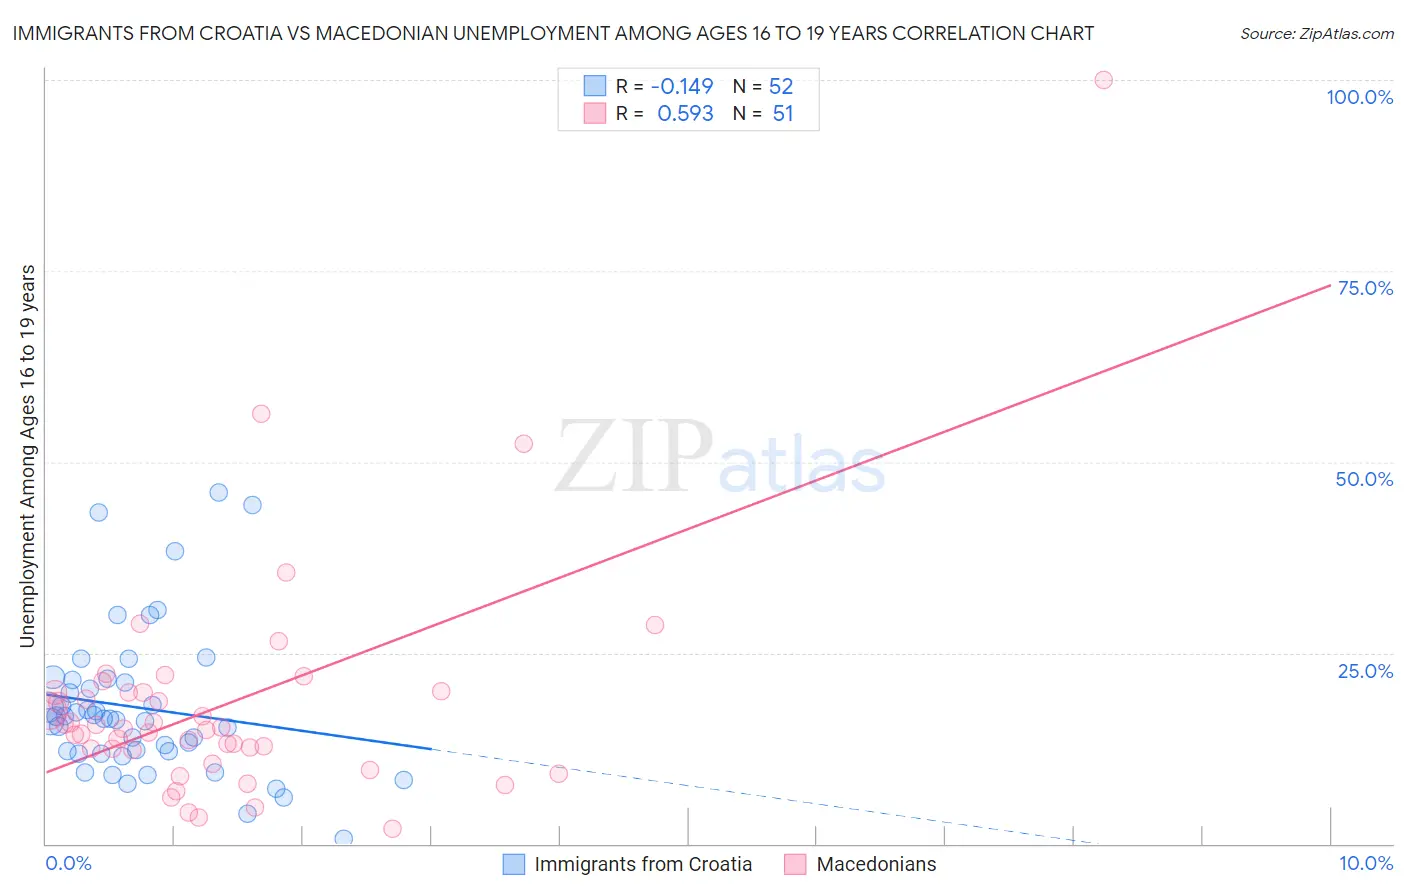
Immigrants from Croatia vs Macedonian Unemployment Among Ages 16 to 19 years Correlation Chart
The statistical analysis conducted on geographies consisting of 128,979,737 people shows a poor negative correlation between the proportion of Immigrants from Croatia and unemployment rate among population between the ages 16 and 19 in the United States with a correlation coefficient (R) of -0.149 and weighted average of 17.3%. Similarly, the statistical analysis conducted on geographies consisting of 129,038,404 people shows a substantial positive correlation between the proportion of Macedonians and unemployment rate among population between the ages 16 and 19 in the United States with a correlation coefficient (R) of 0.593 and weighted average of 16.6%, a difference of 4.2%.
Unemployment Among Ages 16 to 19 years Correlation Summary
| Measurement | Immigrants from Croatia | Macedonian |
| Minimum | 0.60% | 2.0% |
| Maximum | 45.9% | 100.0% |
| Range | 45.3% | 98.0% |
| Mean | 17.8% | 18.3% |
| Median | 16.4% | 15.0% |
| Interquartile 25% (IQ1) | 12.0% | 12.3% |
| Interquartile 75% (IQ3) | 21.3% | 19.9% |
| Interquartile Range (IQR) | 9.4% | 7.6% |
| Standard Deviation (Sample) | 9.7% | 15.5% |
| Standard Deviation (Population) | 9.6% | 15.3% |
Similar Demographics by Unemployment Among Ages 16 to 19 years
Demographics Similar to Immigrants from Croatia by Unemployment Among Ages 16 to 19 years
In terms of unemployment among ages 16 to 19 years, the demographic groups most similar to Immigrants from Croatia are Basque (17.3%, a difference of 0.010%), Immigrants from Eritrea (17.3%, a difference of 0.020%), Bolivian (17.3%, a difference of 0.090%), Spanish (17.3%, a difference of 0.12%), and Immigrants from Egypt (17.3%, a difference of 0.13%).
| Demographics | Rating | Rank | Unemployment Among Ages 16 to 19 years |
| Laotians | 83.9 /100 | #133 | Excellent 17.2% |
| Potawatomi | 83.8 /100 | #134 | Excellent 17.2% |
| Samoans | 83.7 /100 | #135 | Excellent 17.2% |
| Immigrants | Oceania | 83.1 /100 | #136 | Excellent 17.2% |
| Immigrants | Malaysia | 82.8 /100 | #137 | Excellent 17.2% |
| Bolivians | 81.9 /100 | #138 | Excellent 17.3% |
| Immigrants | Eritrea | 81.1 /100 | #139 | Excellent 17.3% |
| Immigrants | Croatia | 80.8 /100 | #140 | Excellent 17.3% |
| Basques | 80.7 /100 | #141 | Excellent 17.3% |
| Spanish | 79.3 /100 | #142 | Good 17.3% |
| Immigrants | Egypt | 79.1 /100 | #143 | Good 17.3% |
| Immigrants | England | 78.9 /100 | #144 | Good 17.3% |
| Indians (Asian) | 77.6 /100 | #145 | Good 17.3% |
| Turks | 77.1 /100 | #146 | Good 17.3% |
| Tsimshian | 76.0 /100 | #147 | Good 17.3% |
Demographics Similar to Macedonians by Unemployment Among Ages 16 to 19 years
In terms of unemployment among ages 16 to 19 years, the demographic groups most similar to Macedonians are Immigrants from Cuba (16.6%, a difference of 0.10%), Menominee (16.6%, a difference of 0.16%), Scotch-Irish (16.6%, a difference of 0.18%), Northern European (16.6%, a difference of 0.25%), and Irish (16.5%, a difference of 0.33%).
| Demographics | Rating | Rank | Unemployment Among Ages 16 to 19 years |
| Czechoslovakians | 99.5 /100 | #55 | Exceptional 16.5% |
| Sri Lankans | 99.5 /100 | #56 | Exceptional 16.5% |
| Immigrants | Jordan | 99.4 /100 | #57 | Exceptional 16.5% |
| Immigrants | Uganda | 99.4 /100 | #58 | Exceptional 16.5% |
| Irish | 99.4 /100 | #59 | Exceptional 16.5% |
| Menominee | 99.3 /100 | #60 | Exceptional 16.6% |
| Immigrants | Cuba | 99.2 /100 | #61 | Exceptional 16.6% |
| Macedonians | 99.2 /100 | #62 | Exceptional 16.6% |
| Scotch-Irish | 99.1 /100 | #63 | Exceptional 16.6% |
| Northern Europeans | 99.0 /100 | #64 | Exceptional 16.6% |
| Immigrants | Japan | 98.9 /100 | #65 | Exceptional 16.6% |
| Okinawans | 98.9 /100 | #66 | Exceptional 16.6% |
| Slavs | 98.7 /100 | #67 | Exceptional 16.7% |
| Chickasaw | 98.7 /100 | #68 | Exceptional 16.7% |
| Serbians | 98.7 /100 | #69 | Exceptional 16.7% |