Immigrants from Croatia vs French Single Mother Poverty
COMPARE
Immigrants from Croatia
French
Single Mother Poverty
Single Mother Poverty Comparison
Immigrants from Croatia
French
28.0%
SINGLE MOTHER POVERTY
96.7/ 100
METRIC RATING
102nd/ 347
METRIC RANK
30.7%
SINGLE MOTHER POVERTY
1.3/ 100
METRIC RATING
244th/ 347
METRIC RANK
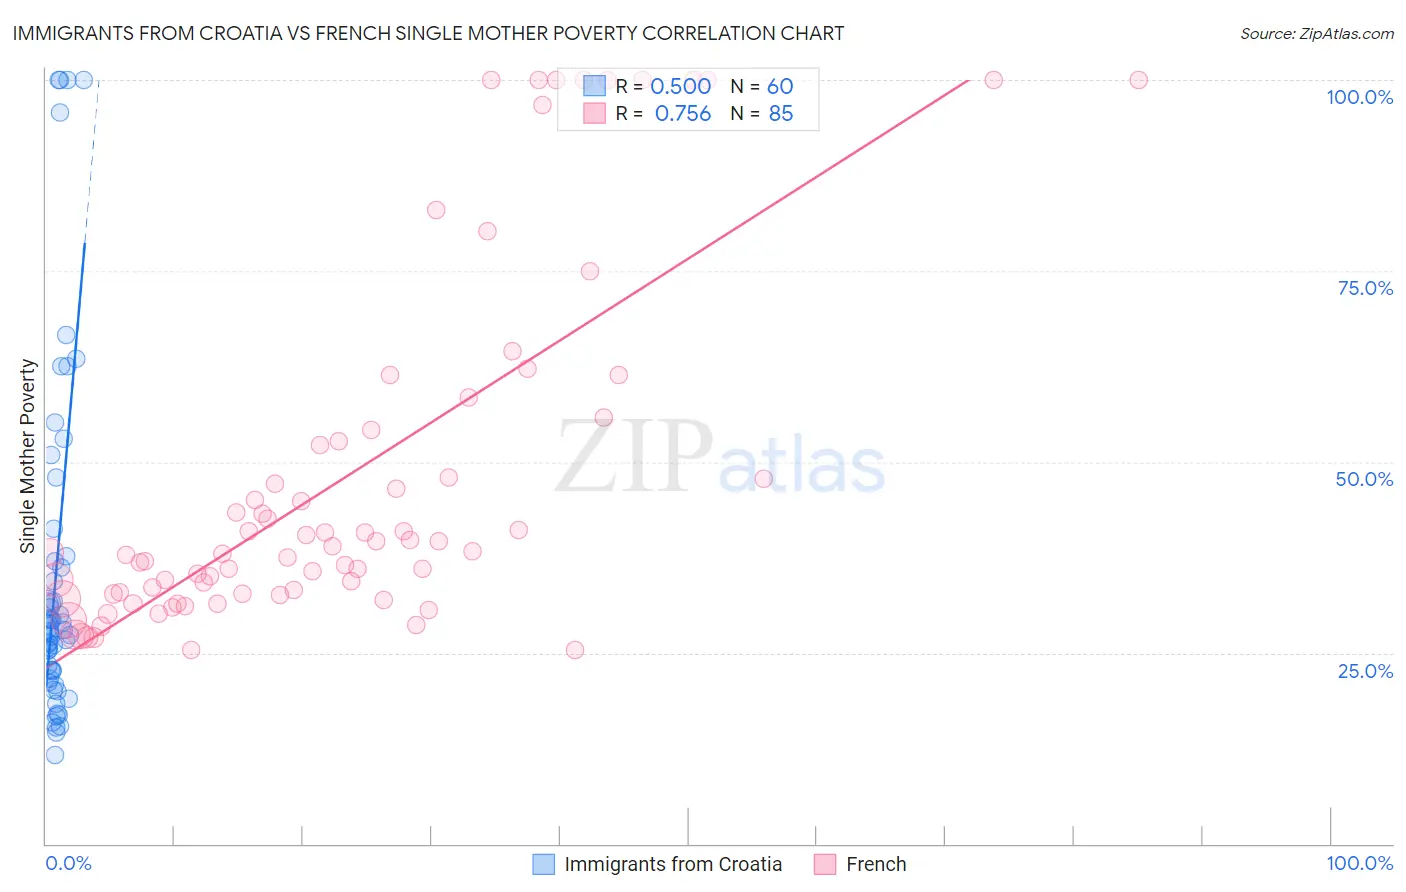
Immigrants from Croatia vs French Single Mother Poverty Correlation Chart
The statistical analysis conducted on geographies consisting of 130,792,597 people shows a moderate positive correlation between the proportion of Immigrants from Croatia and poverty level among single mothers in the United States with a correlation coefficient (R) of 0.500 and weighted average of 28.0%. Similarly, the statistical analysis conducted on geographies consisting of 544,044,699 people shows a strong positive correlation between the proportion of French and poverty level among single mothers in the United States with a correlation coefficient (R) of 0.756 and weighted average of 30.7%, a difference of 9.6%.
Single Mother Poverty Correlation Summary
| Measurement | Immigrants from Croatia | French |
| Minimum | 11.6% | 25.4% |
| Maximum | 100.0% | 100.0% |
| Range | 88.4% | 74.6% |
| Mean | 35.8% | 47.9% |
| Median | 27.9% | 38.3% |
| Interquartile 25% (IQ1) | 22.2% | 32.7% |
| Interquartile 75% (IQ3) | 37.3% | 53.4% |
| Interquartile Range (IQR) | 15.1% | 20.8% |
| Standard Deviation (Sample) | 23.1% | 23.1% |
| Standard Deviation (Population) | 22.9% | 23.0% |
Similar Demographics by Single Mother Poverty
Demographics Similar to Immigrants from Croatia by Single Mother Poverty
In terms of single mother poverty, the demographic groups most similar to Immigrants from Croatia are Immigrants from Northern Africa (28.0%, a difference of 0.020%), Italian (28.0%, a difference of 0.030%), Israeli (28.0%, a difference of 0.060%), Pakistani (28.0%, a difference of 0.10%), and Ukrainian (28.0%, a difference of 0.10%).
| Demographics | Rating | Rank | Single Mother Poverty |
| Chileans | 97.5 /100 | #95 | Exceptional 27.9% |
| Immigrants | Iraq | 97.3 /100 | #96 | Exceptional 27.9% |
| Immigrants | Brazil | 97.2 /100 | #97 | Exceptional 27.9% |
| Immigrants | Nepal | 97.2 /100 | #98 | Exceptional 27.9% |
| Immigrants | Netherlands | 97.2 /100 | #99 | Exceptional 27.9% |
| Zimbabweans | 97.1 /100 | #100 | Exceptional 27.9% |
| Pakistanis | 96.9 /100 | #101 | Exceptional 28.0% |
| Immigrants | Croatia | 96.7 /100 | #102 | Exceptional 28.0% |
| Immigrants | Northern Africa | 96.6 /100 | #103 | Exceptional 28.0% |
| Italians | 96.6 /100 | #104 | Exceptional 28.0% |
| Israelis | 96.5 /100 | #105 | Exceptional 28.0% |
| Ukrainians | 96.4 /100 | #106 | Exceptional 28.0% |
| Immigrants | Venezuela | 95.8 /100 | #107 | Exceptional 28.1% |
| Immigrants | Zimbabwe | 95.5 /100 | #108 | Exceptional 28.1% |
| Immigrants | Armenia | 95.2 /100 | #109 | Exceptional 28.1% |
Demographics Similar to French by Single Mother Poverty
In terms of single mother poverty, the demographic groups most similar to French are Barbadian (30.7%, a difference of 0.010%), Bermudan (30.6%, a difference of 0.22%), Immigrants from Burma/Myanmar (30.6%, a difference of 0.30%), Immigrants from Laos (30.6%, a difference of 0.32%), and Salvadoran (30.6%, a difference of 0.37%).
| Demographics | Rating | Rank | Single Mother Poverty |
| Immigrants | St. Vincent and the Grenadines | 3.1 /100 | #237 | Tragic 30.4% |
| Slovaks | 2.8 /100 | #238 | Tragic 30.4% |
| Immigrants | Portugal | 2.1 /100 | #239 | Tragic 30.5% |
| Salvadorans | 1.8 /100 | #240 | Tragic 30.6% |
| Immigrants | Laos | 1.8 /100 | #241 | Tragic 30.6% |
| Immigrants | Burma/Myanmar | 1.7 /100 | #242 | Tragic 30.6% |
| Bermudans | 1.6 /100 | #243 | Tragic 30.6% |
| French | 1.3 /100 | #244 | Tragic 30.7% |
| Barbadians | 1.3 /100 | #245 | Tragic 30.7% |
| Ecuadorians | 0.9 /100 | #246 | Tragic 30.8% |
| West Indians | 0.9 /100 | #247 | Tragic 30.8% |
| French Canadians | 0.9 /100 | #248 | Tragic 30.8% |
| Cape Verdeans | 0.8 /100 | #249 | Tragic 30.8% |
| Vietnamese | 0.7 /100 | #250 | Tragic 30.9% |
| Tlingit-Haida | 0.6 /100 | #251 | Tragic 30.9% |