Immigrants from Congo vs Immigrants from North America Female Poverty Among 18-24 Year Olds
COMPARE
Immigrants from Congo
Immigrants from North America
Female Poverty Among 18-24 Year Olds
Female Poverty Among 18-24 Year Olds Comparison
Immigrants from Congo
Immigrants from North America
24.6%
FEMALE POVERTY AMONG 18-24 YEAR OLDS
0.0/ 100
METRIC RATING
320th/ 347
METRIC RANK
19.5%
FEMALE POVERTY AMONG 18-24 YEAR OLDS
92.1/ 100
METRIC RATING
134th/ 347
METRIC RANK
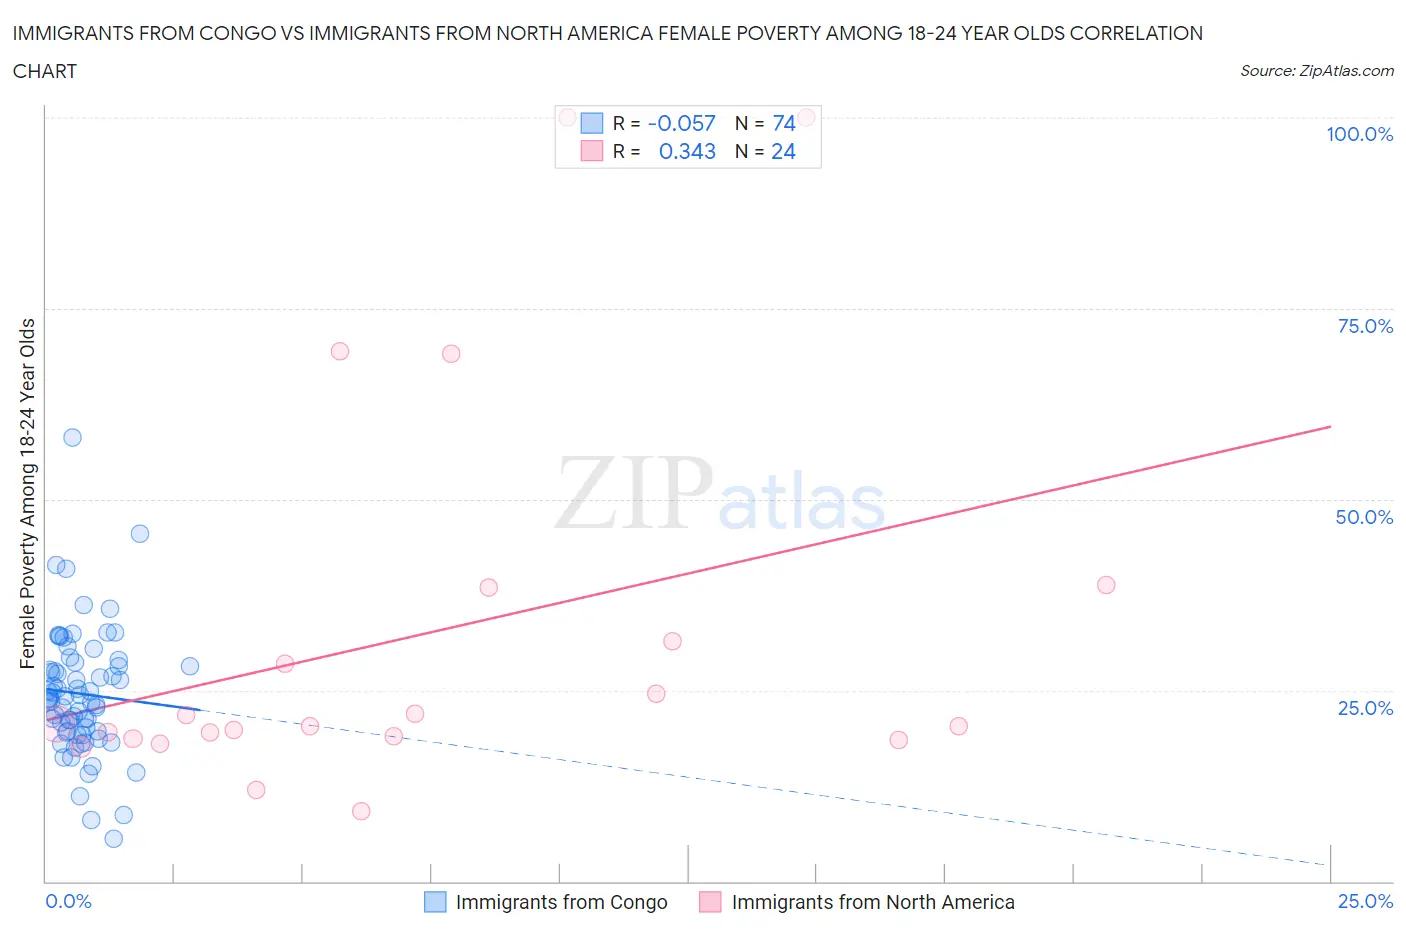
Immigrants from Congo vs Immigrants from North America Female Poverty Among 18-24 Year Olds Correlation Chart
The statistical analysis conducted on geographies consisting of 91,799,806 people shows a slight negative correlation between the proportion of Immigrants from Congo and poverty level among females between the ages 18 and 24 in the United States with a correlation coefficient (R) of -0.057 and weighted average of 24.6%. Similarly, the statistical analysis conducted on geographies consisting of 445,818,152 people shows a mild positive correlation between the proportion of Immigrants from North America and poverty level among females between the ages 18 and 24 in the United States with a correlation coefficient (R) of 0.343 and weighted average of 19.5%, a difference of 26.0%.
Female Poverty Among 18-24 Year Olds Correlation Summary
| Measurement | Immigrants from Congo | Immigrants from North America |
| Minimum | 5.6% | 9.1% |
| Maximum | 58.1% | 100.0% |
| Range | 52.5% | 90.9% |
| Mean | 24.6% | 32.3% |
| Median | 24.0% | 20.5% |
| Interquartile 25% (IQ1) | 19.6% | 18.8% |
| Interquartile 75% (IQ3) | 28.2% | 34.9% |
| Interquartile Range (IQR) | 8.6% | 16.1% |
| Standard Deviation (Sample) | 8.3% | 25.6% |
| Standard Deviation (Population) | 8.2% | 25.1% |
Similar Demographics by Female Poverty Among 18-24 Year Olds
Demographics Similar to Immigrants from Congo by Female Poverty Among 18-24 Year Olds
In terms of female poverty among 18-24 year olds, the demographic groups most similar to Immigrants from Congo are Dutch West Indian (24.5%, a difference of 0.30%), Chickasaw (24.5%, a difference of 0.40%), Osage (24.5%, a difference of 0.48%), Alsatian (24.4%, a difference of 0.78%), and Black/African American (24.3%, a difference of 1.1%).
| Demographics | Rating | Rank | Female Poverty Among 18-24 Year Olds |
| Creek | 0.0 /100 | #313 | Tragic 24.2% |
| Choctaw | 0.0 /100 | #314 | Tragic 24.3% |
| Blacks/African Americans | 0.0 /100 | #315 | Tragic 24.3% |
| Alsatians | 0.0 /100 | #316 | Tragic 24.4% |
| Osage | 0.0 /100 | #317 | Tragic 24.5% |
| Chickasaw | 0.0 /100 | #318 | Tragic 24.5% |
| Dutch West Indians | 0.0 /100 | #319 | Tragic 24.5% |
| Immigrants | Congo | 0.0 /100 | #320 | Tragic 24.6% |
| Immigrants | Zaire | 0.0 /100 | #321 | Tragic 25.1% |
| Somalis | 0.0 /100 | #322 | Tragic 25.1% |
| Arapaho | 0.0 /100 | #323 | Tragic 25.2% |
| German Russians | 0.0 /100 | #324 | Tragic 25.2% |
| Immigrants | Saudi Arabia | 0.0 /100 | #325 | Tragic 25.3% |
| Yakama | 0.0 /100 | #326 | Tragic 25.3% |
| Ute | 0.0 /100 | #327 | Tragic 25.4% |
Demographics Similar to Immigrants from North America by Female Poverty Among 18-24 Year Olds
In terms of female poverty among 18-24 year olds, the demographic groups most similar to Immigrants from North America are Jamaican (19.5%, a difference of 0.010%), Turkish (19.5%, a difference of 0.010%), Soviet Union (19.5%, a difference of 0.010%), Latvian (19.5%, a difference of 0.11%), and Russian (19.5%, a difference of 0.11%).
| Demographics | Rating | Rank | Female Poverty Among 18-24 Year Olds |
| Cape Verdeans | 93.6 /100 | #127 | Exceptional 19.4% |
| Slovaks | 92.9 /100 | #128 | Exceptional 19.5% |
| Immigrants | England | 92.9 /100 | #129 | Exceptional 19.5% |
| Immigrants | Canada | 92.9 /100 | #130 | Exceptional 19.5% |
| Latvians | 92.7 /100 | #131 | Exceptional 19.5% |
| Jamaicans | 92.1 /100 | #132 | Exceptional 19.5% |
| Turks | 92.1 /100 | #133 | Exceptional 19.5% |
| Immigrants | North America | 92.1 /100 | #134 | Exceptional 19.5% |
| Soviet Union | 92.0 /100 | #135 | Exceptional 19.5% |
| Russians | 91.5 /100 | #136 | Exceptional 19.5% |
| Austrians | 90.7 /100 | #137 | Exceptional 19.5% |
| Immigrants | Morocco | 89.9 /100 | #138 | Excellent 19.6% |
| Indians (Asian) | 88.3 /100 | #139 | Excellent 19.6% |
| Immigrants | Trinidad and Tobago | 85.6 /100 | #140 | Excellent 19.7% |
| Pennsylvania Germans | 85.5 /100 | #141 | Excellent 19.7% |