Immigrants from Colombia vs Spanish Currently Married
COMPARE
Immigrants from Colombia
Spanish
Currently Married
Currently Married Comparison
Immigrants from Colombia
Spanish
46.1%
CURRENTLY MARRIED
21.0/ 100
METRIC RATING
198th/ 347
METRIC RANK
47.0%
CURRENTLY MARRIED
68.1/ 100
METRIC RATING
156th/ 347
METRIC RANK
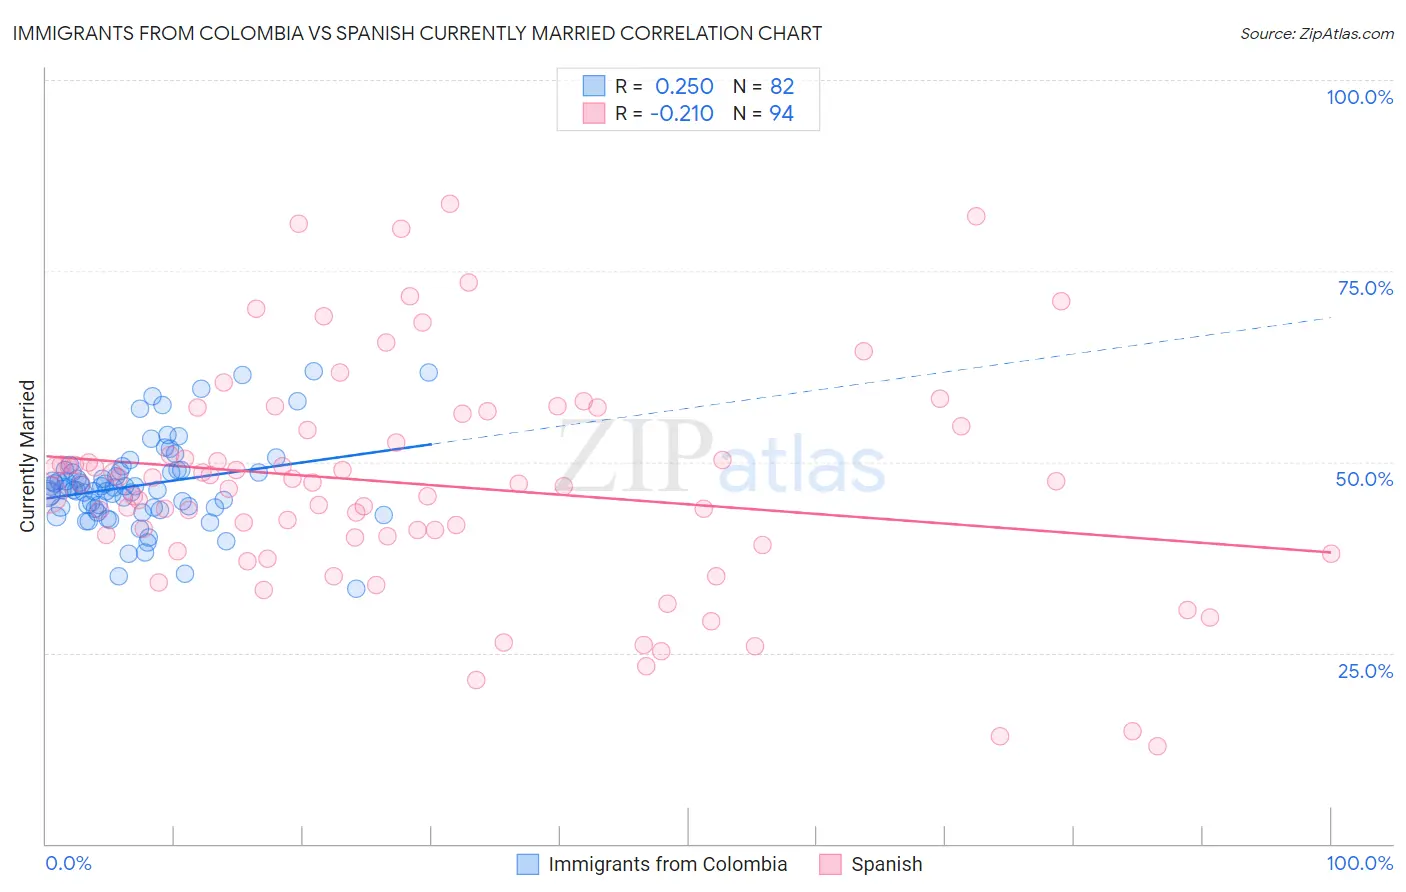
Immigrants from Colombia vs Spanish Currently Married Correlation Chart
The statistical analysis conducted on geographies consisting of 378,670,909 people shows a weak positive correlation between the proportion of Immigrants from Colombia and percentage of population currently married in the United States with a correlation coefficient (R) of 0.250 and weighted average of 46.1%. Similarly, the statistical analysis conducted on geographies consisting of 422,154,276 people shows a weak negative correlation between the proportion of Spanish and percentage of population currently married in the United States with a correlation coefficient (R) of -0.210 and weighted average of 47.0%, a difference of 1.9%.
Currently Married Correlation Summary
| Measurement | Immigrants from Colombia | Spanish |
| Minimum | 33.3% | 12.8% |
| Maximum | 61.9% | 83.7% |
| Range | 28.6% | 70.9% |
| Mean | 47.0% | 47.0% |
| Median | 46.5% | 47.2% |
| Interquartile 25% (IQ1) | 44.0% | 40.1% |
| Interquartile 75% (IQ3) | 48.9% | 54.2% |
| Interquartile Range (IQR) | 4.9% | 14.1% |
| Standard Deviation (Sample) | 5.6% | 14.5% |
| Standard Deviation (Population) | 5.6% | 14.4% |
Similar Demographics by Currently Married
Demographics Similar to Immigrants from Colombia by Currently Married
In terms of currently married, the demographic groups most similar to Immigrants from Colombia are Immigrants from Kuwait (46.1%, a difference of 0.040%), Immigrants from Bosnia and Herzegovina (46.1%, a difference of 0.070%), Immigrants from Costa Rica (46.0%, a difference of 0.080%), Immigrants from Nepal (46.1%, a difference of 0.14%), and South American (46.1%, a difference of 0.15%).
| Demographics | Rating | Rank | Currently Married |
| Immigrants | France | 27.7 /100 | #191 | Fair 46.2% |
| Soviet Union | 25.7 /100 | #192 | Fair 46.2% |
| Immigrants | Fiji | 25.0 /100 | #193 | Fair 46.2% |
| South Americans | 23.8 /100 | #194 | Fair 46.1% |
| Immigrants | Nepal | 23.7 /100 | #195 | Fair 46.1% |
| Immigrants | Bosnia and Herzegovina | 22.2 /100 | #196 | Fair 46.1% |
| Immigrants | Kuwait | 21.7 /100 | #197 | Fair 46.1% |
| Immigrants | Colombia | 21.0 /100 | #198 | Fair 46.1% |
| Immigrants | Costa Rica | 19.6 /100 | #199 | Poor 46.0% |
| Creek | 17.2 /100 | #200 | Poor 46.0% |
| Malaysians | 15.3 /100 | #201 | Poor 45.9% |
| Immigrants | Albania | 14.5 /100 | #202 | Poor 45.9% |
| Taiwanese | 11.7 /100 | #203 | Poor 45.8% |
| Immigrants | Spain | 11.6 /100 | #204 | Poor 45.8% |
| South American Indians | 11.5 /100 | #205 | Poor 45.8% |
Demographics Similar to Spanish by Currently Married
In terms of currently married, the demographic groups most similar to Spanish are Immigrants from Switzerland (46.9%, a difference of 0.010%), Immigrants from Venezuela (47.0%, a difference of 0.020%), Albanian (47.0%, a difference of 0.020%), Arab (47.0%, a difference of 0.020%), and Immigrants from Serbia (47.0%, a difference of 0.030%).
| Demographics | Rating | Rank | Currently Married |
| Zimbabweans | 70.1 /100 | #149 | Good 47.0% |
| Immigrants | Turkey | 70.0 /100 | #150 | Good 47.0% |
| Chileans | 69.8 /100 | #151 | Good 47.0% |
| Immigrants | Serbia | 68.8 /100 | #152 | Good 47.0% |
| Immigrants | Venezuela | 68.6 /100 | #153 | Good 47.0% |
| Albanians | 68.6 /100 | #154 | Good 47.0% |
| Arabs | 68.6 /100 | #155 | Good 47.0% |
| Spanish | 68.1 /100 | #156 | Good 47.0% |
| Immigrants | Switzerland | 67.8 /100 | #157 | Good 46.9% |
| Cherokee | 66.8 /100 | #158 | Good 46.9% |
| Iraqis | 66.4 /100 | #159 | Good 46.9% |
| Immigrants | Uzbekistan | 66.0 /100 | #160 | Good 46.9% |
| Immigrants | Southern Europe | 65.9 /100 | #161 | Good 46.9% |
| Immigrants | Nonimmigrants | 65.4 /100 | #162 | Good 46.9% |
| Delaware | 64.7 /100 | #163 | Good 46.9% |