Immigrants from Colombia vs Pennsylvania German Unemployment Among Ages 55 to 59 years
COMPARE
Immigrants from Colombia
Pennsylvania German
Unemployment Among Ages 55 to 59 years
Unemployment Among Ages 55 to 59 years Comparison
Immigrants from Colombia
Pennsylvania Germans
4.7%
UNEMPLOYMENT AMONG AGES 55 TO 59 YEARS
96.9/ 100
METRIC RATING
86th/ 347
METRIC RANK
4.7%
UNEMPLOYMENT AMONG AGES 55 TO 59 YEARS
87.1/ 100
METRIC RATING
128th/ 347
METRIC RANK
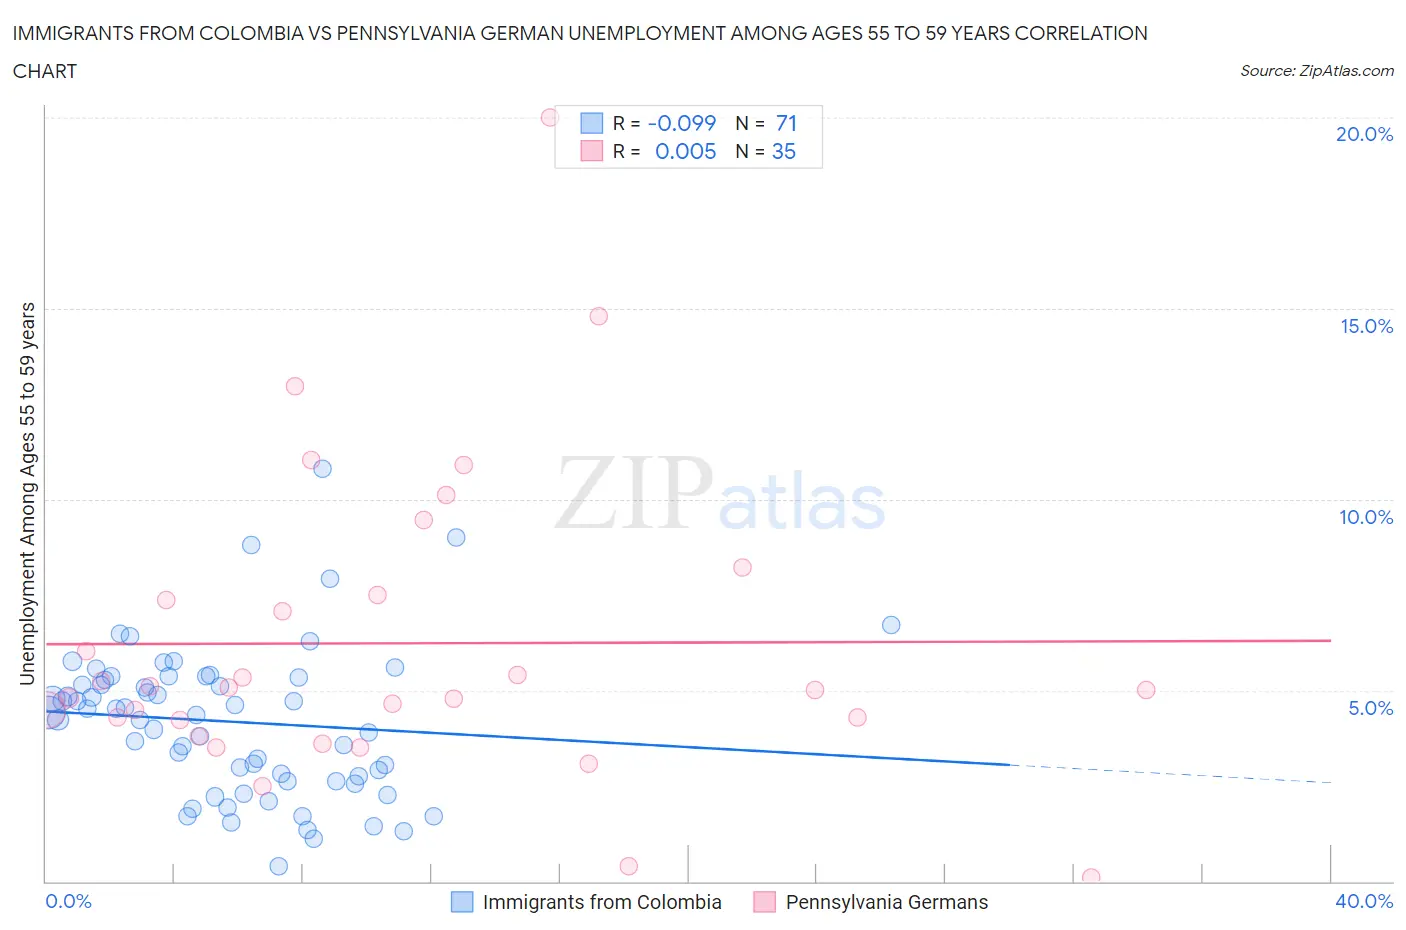
Immigrants from Colombia vs Pennsylvania German Unemployment Among Ages 55 to 59 years Correlation Chart
The statistical analysis conducted on geographies consisting of 355,214,802 people shows a slight negative correlation between the proportion of Immigrants from Colombia and unemployment rate among population between the ages 55 and 59 in the United States with a correlation coefficient (R) of -0.099 and weighted average of 4.7%. Similarly, the statistical analysis conducted on geographies consisting of 218,034,331 people shows no correlation between the proportion of Pennsylvania Germans and unemployment rate among population between the ages 55 and 59 in the United States with a correlation coefficient (R) of 0.005 and weighted average of 4.7%, a difference of 1.6%.
Unemployment Among Ages 55 to 59 years Correlation Summary
| Measurement | Immigrants from Colombia | Pennsylvania German |
| Minimum | 0.40% | 0.10% |
| Maximum | 10.8% | 20.0% |
| Range | 10.4% | 19.9% |
| Mean | 4.2% | 6.2% |
| Median | 4.4% | 5.0% |
| Interquartile 25% (IQ1) | 2.6% | 4.2% |
| Interquartile 75% (IQ3) | 5.3% | 7.5% |
| Interquartile Range (IQR) | 2.7% | 3.3% |
| Standard Deviation (Sample) | 2.0% | 4.0% |
| Standard Deviation (Population) | 1.9% | 3.9% |
Similar Demographics by Unemployment Among Ages 55 to 59 years
Demographics Similar to Immigrants from Colombia by Unemployment Among Ages 55 to 59 years
In terms of unemployment among ages 55 to 59 years, the demographic groups most similar to Immigrants from Colombia are Malaysian (4.7%, a difference of 0.0%), Immigrants from Vietnam (4.7%, a difference of 0.0%), Polish (4.7%, a difference of 0.020%), Immigrants from Cameroon (4.7%, a difference of 0.020%), and Irish (4.7%, a difference of 0.040%).
| Demographics | Rating | Rank | Unemployment Among Ages 55 to 59 years |
| Sri Lankans | 98.1 /100 | #79 | Exceptional 4.6% |
| Cambodians | 98.0 /100 | #80 | Exceptional 4.6% |
| Taiwanese | 97.9 /100 | #81 | Exceptional 4.6% |
| Latvians | 97.8 /100 | #82 | Exceptional 4.6% |
| Lebanese | 97.5 /100 | #83 | Exceptional 4.6% |
| Malaysians | 96.9 /100 | #84 | Exceptional 4.7% |
| Immigrants | Vietnam | 96.9 /100 | #85 | Exceptional 4.7% |
| Immigrants | Colombia | 96.9 /100 | #86 | Exceptional 4.7% |
| Poles | 96.9 /100 | #87 | Exceptional 4.7% |
| Immigrants | Cameroon | 96.9 /100 | #88 | Exceptional 4.7% |
| Irish | 96.8 /100 | #89 | Exceptional 4.7% |
| Immigrants | Poland | 96.4 /100 | #90 | Exceptional 4.7% |
| New Zealanders | 96.3 /100 | #91 | Exceptional 4.7% |
| Iraqis | 96.1 /100 | #92 | Exceptional 4.7% |
| Immigrants | England | 95.8 /100 | #93 | Exceptional 4.7% |
Demographics Similar to Pennsylvania Germans by Unemployment Among Ages 55 to 59 years
In terms of unemployment among ages 55 to 59 years, the demographic groups most similar to Pennsylvania Germans are Immigrants from Sweden (4.7%, a difference of 0.030%), Greek (4.7%, a difference of 0.040%), Icelander (4.7%, a difference of 0.050%), Immigrants from Serbia (4.7%, a difference of 0.060%), and Immigrants from Malaysia (4.7%, a difference of 0.080%).
| Demographics | Rating | Rank | Unemployment Among Ages 55 to 59 years |
| Pakistanis | 89.7 /100 | #121 | Excellent 4.7% |
| Immigrants | Afghanistan | 89.5 /100 | #122 | Excellent 4.7% |
| Immigrants | Japan | 89.4 /100 | #123 | Excellent 4.7% |
| Lithuanians | 88.8 /100 | #124 | Excellent 4.7% |
| Immigrants | Malaysia | 87.9 /100 | #125 | Excellent 4.7% |
| Immigrants | Serbia | 87.8 /100 | #126 | Excellent 4.7% |
| Icelanders | 87.7 /100 | #127 | Excellent 4.7% |
| Pennsylvania Germans | 87.1 /100 | #128 | Excellent 4.7% |
| Immigrants | Sweden | 86.8 /100 | #129 | Excellent 4.7% |
| Greeks | 86.6 /100 | #130 | Excellent 4.7% |
| Immigrants | Thailand | 85.4 /100 | #131 | Excellent 4.7% |
| Immigrants | Romania | 85.3 /100 | #132 | Excellent 4.7% |
| Immigrants | Netherlands | 84.5 /100 | #133 | Excellent 4.7% |
| Panamanians | 84.1 /100 | #134 | Excellent 4.7% |
| Slavs | 83.7 /100 | #135 | Excellent 4.7% |