Immigrants from Chile vs British Poverty
COMPARE
Immigrants from Chile
British
Poverty
Poverty Comparison
Immigrants from Chile
British
12.2%
POVERTY
56.7/ 100
METRIC RATING
167th/ 347
METRIC RANK
11.4%
POVERTY
95.0/ 100
METRIC RATING
92nd/ 347
METRIC RANK
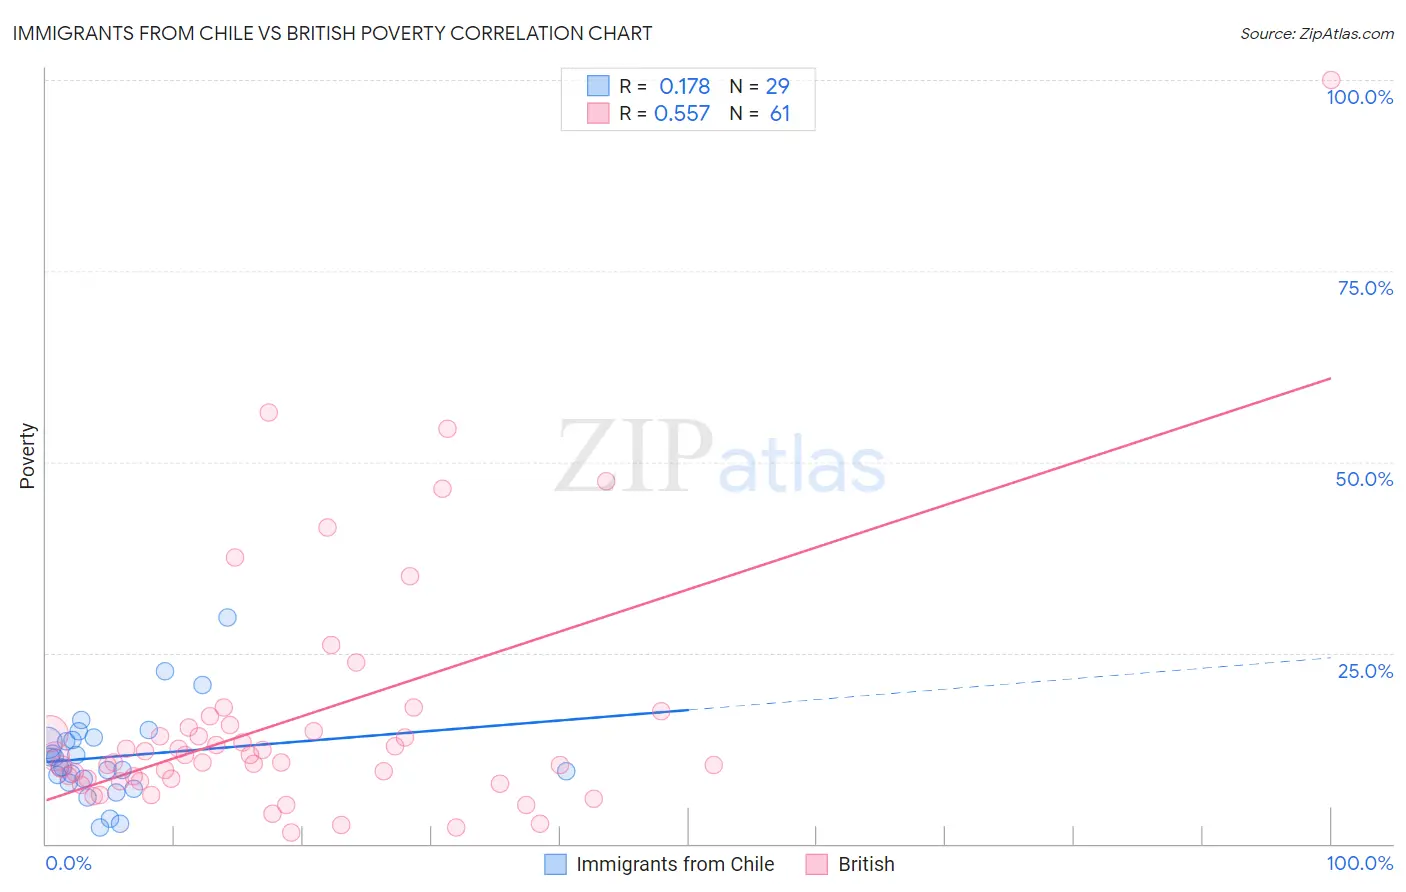
Immigrants from Chile vs British Poverty Correlation Chart
The statistical analysis conducted on geographies consisting of 218,605,054 people shows a poor positive correlation between the proportion of Immigrants from Chile and poverty level in the United States with a correlation coefficient (R) of 0.178 and weighted average of 12.2%. Similarly, the statistical analysis conducted on geographies consisting of 530,938,105 people shows a substantial positive correlation between the proportion of British and poverty level in the United States with a correlation coefficient (R) of 0.557 and weighted average of 11.4%, a difference of 7.0%.
Poverty Correlation Summary
| Measurement | Immigrants from Chile | British |
| Minimum | 2.2% | 1.5% |
| Maximum | 29.7% | 100.0% |
| Range | 27.5% | 98.5% |
| Mean | 11.4% | 16.2% |
| Median | 10.0% | 11.4% |
| Interquartile 25% (IQ1) | 8.2% | 8.4% |
| Interquartile 75% (IQ3) | 13.8% | 15.4% |
| Interquartile Range (IQR) | 5.6% | 7.0% |
| Standard Deviation (Sample) | 5.8% | 16.5% |
| Standard Deviation (Population) | 5.7% | 16.3% |
Similar Demographics by Poverty
Demographics Similar to Immigrants from Chile by Poverty
In terms of poverty, the demographic groups most similar to Immigrants from Chile are Venezuelan (12.2%, a difference of 0.020%), Immigrants from Venezuela (12.2%, a difference of 0.020%), Colombian (12.2%, a difference of 0.11%), Immigrants from Albania (12.2%, a difference of 0.11%), and White/Caucasian (12.3%, a difference of 0.13%).
| Demographics | Rating | Rank | Poverty |
| Immigrants | Nepal | 60.4 /100 | #160 | Good 12.2% |
| Immigrants | Fiji | 59.1 /100 | #161 | Average 12.2% |
| Ethiopians | 59.1 /100 | #162 | Average 12.2% |
| Immigrants | Ethiopia | 58.6 /100 | #163 | Average 12.2% |
| Colombians | 57.8 /100 | #164 | Average 12.2% |
| Immigrants | Albania | 57.7 /100 | #165 | Average 12.2% |
| Venezuelans | 56.9 /100 | #166 | Average 12.2% |
| Immigrants | Chile | 56.7 /100 | #167 | Average 12.2% |
| Immigrants | Venezuela | 56.5 /100 | #168 | Average 12.2% |
| Whites/Caucasians | 55.4 /100 | #169 | Average 12.3% |
| Immigrants | Oceania | 54.6 /100 | #170 | Average 12.3% |
| Immigrants | Spain | 51.3 /100 | #171 | Average 12.3% |
| Immigrants | Portugal | 50.5 /100 | #172 | Average 12.3% |
| Celtics | 50.1 /100 | #173 | Average 12.3% |
| Lebanese | 50.0 /100 | #174 | Average 12.3% |
Demographics Similar to British by Poverty
In terms of poverty, the demographic groups most similar to British are Romanian (11.4%, a difference of 0.030%), Paraguayan (11.4%, a difference of 0.060%), Australian (11.4%, a difference of 0.060%), Finnish (11.4%, a difference of 0.14%), and Immigrants from South Africa (11.5%, a difference of 0.18%).
| Demographics | Rating | Rank | Poverty |
| Immigrants | England | 96.2 /100 | #85 | Exceptional 11.4% |
| Jordanians | 96.0 /100 | #86 | Exceptional 11.4% |
| Northern Europeans | 96.0 /100 | #87 | Exceptional 11.4% |
| Belgians | 95.8 /100 | #88 | Exceptional 11.4% |
| Czechoslovakians | 95.7 /100 | #89 | Exceptional 11.4% |
| Immigrants | Denmark | 95.5 /100 | #90 | Exceptional 11.4% |
| Finns | 95.2 /100 | #91 | Exceptional 11.4% |
| British | 95.0 /100 | #92 | Exceptional 11.4% |
| Romanians | 94.9 /100 | #93 | Exceptional 11.4% |
| Paraguayans | 94.9 /100 | #94 | Exceptional 11.4% |
| Australians | 94.9 /100 | #95 | Exceptional 11.4% |
| Immigrants | South Africa | 94.7 /100 | #96 | Exceptional 11.5% |
| Immigrants | Egypt | 94.6 /100 | #97 | Exceptional 11.5% |
| Immigrants | Latvia | 94.5 /100 | #98 | Exceptional 11.5% |
| Immigrants | Indonesia | 94.2 /100 | #99 | Exceptional 11.5% |