Immigrants from Chile vs Immigrants from Korea Male Poverty
COMPARE
Immigrants from Chile
Immigrants from Korea
Male Poverty
Male Poverty Comparison
Immigrants from Chile
Immigrants from Korea
11.1%
MALE POVERTY
57.4/ 100
METRIC RATING
162nd/ 347
METRIC RANK
9.7%
MALE POVERTY
99.6/ 100
METRIC RATING
28th/ 347
METRIC RANK
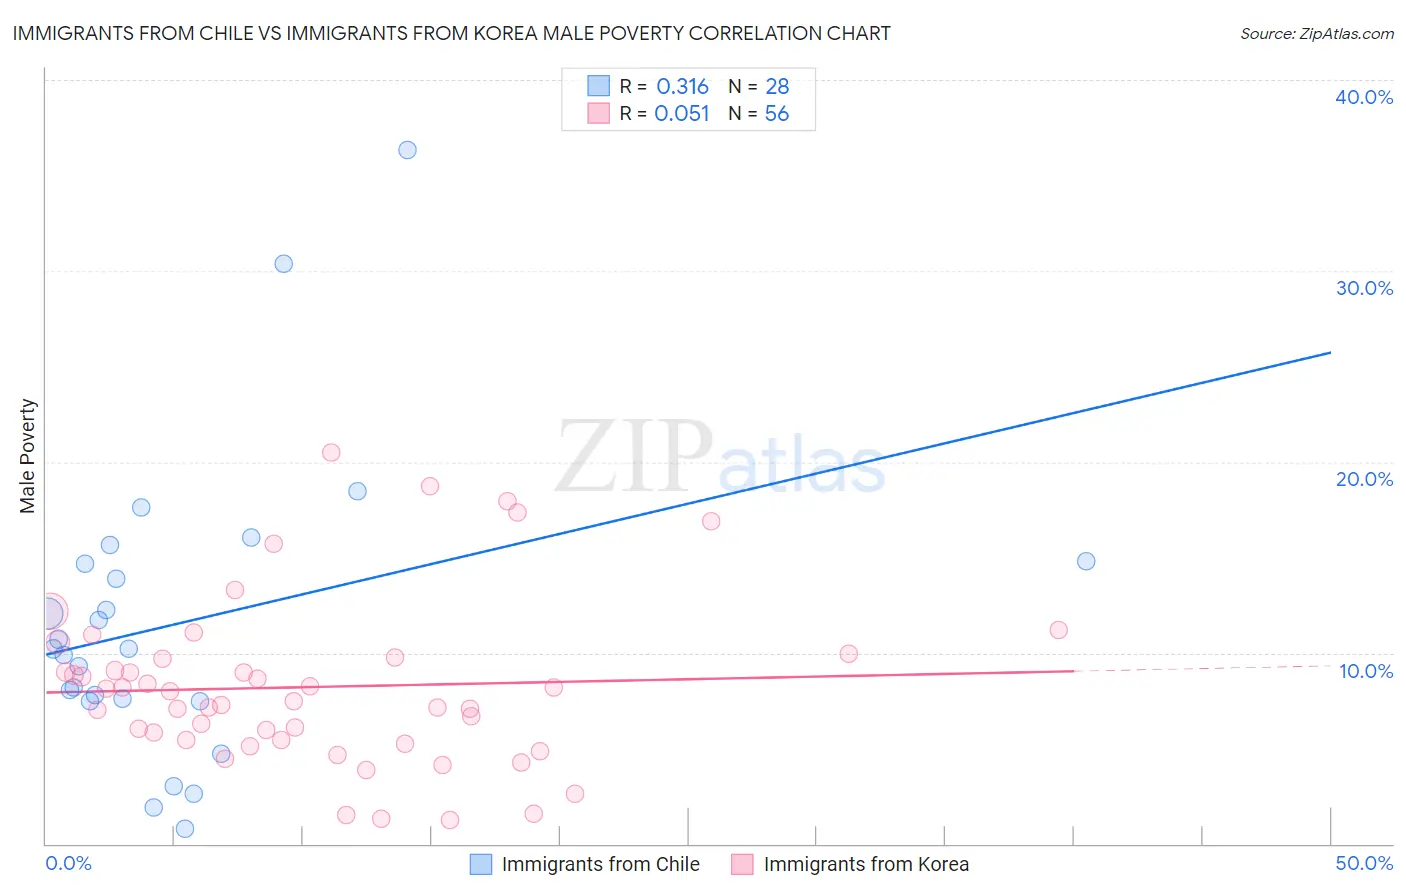
Immigrants from Chile vs Immigrants from Korea Male Poverty Correlation Chart
The statistical analysis conducted on geographies consisting of 218,566,097 people shows a mild positive correlation between the proportion of Immigrants from Chile and poverty level among males in the United States with a correlation coefficient (R) of 0.316 and weighted average of 11.1%. Similarly, the statistical analysis conducted on geographies consisting of 415,786,791 people shows a slight positive correlation between the proportion of Immigrants from Korea and poverty level among males in the United States with a correlation coefficient (R) of 0.051 and weighted average of 9.7%, a difference of 14.5%.
Male Poverty Correlation Summary
| Measurement | Immigrants from Chile | Immigrants from Korea |
| Minimum | 0.80% | 1.2% |
| Maximum | 36.4% | 20.5% |
| Range | 35.6% | 19.2% |
| Mean | 11.6% | 8.2% |
| Median | 10.2% | 7.7% |
| Interquartile 25% (IQ1) | 7.5% | 5.4% |
| Interquartile 75% (IQ3) | 14.8% | 9.7% |
| Interquartile Range (IQR) | 7.2% | 4.3% |
| Standard Deviation (Sample) | 7.8% | 4.3% |
| Standard Deviation (Population) | 7.6% | 4.3% |
Similar Demographics by Male Poverty
Demographics Similar to Immigrants from Chile by Male Poverty
In terms of male poverty, the demographic groups most similar to Immigrants from Chile are White/Caucasian (11.1%, a difference of 0.060%), Ethiopian (11.1%, a difference of 0.070%), Immigrants from Spain (11.1%, a difference of 0.19%), Immigrants from Albania (11.1%, a difference of 0.21%), and Hungarian (11.1%, a difference of 0.22%).
| Demographics | Rating | Rank | Male Poverty |
| Immigrants | Malaysia | 64.7 /100 | #155 | Good 11.0% |
| Costa Ricans | 63.9 /100 | #156 | Good 11.0% |
| Scotch-Irish | 63.7 /100 | #157 | Good 11.0% |
| Colombians | 63.0 /100 | #158 | Good 11.0% |
| Taiwanese | 62.7 /100 | #159 | Good 11.0% |
| Soviet Union | 60.3 /100 | #160 | Good 11.1% |
| Immigrants | Northern Africa | 59.7 /100 | #161 | Average 11.1% |
| Immigrants | Chile | 57.4 /100 | #162 | Average 11.1% |
| Whites/Caucasians | 56.7 /100 | #163 | Average 11.1% |
| Ethiopians | 56.7 /100 | #164 | Average 11.1% |
| Immigrants | Spain | 55.5 /100 | #165 | Average 11.1% |
| Immigrants | Albania | 55.3 /100 | #166 | Average 11.1% |
| Hungarians | 55.1 /100 | #167 | Average 11.1% |
| Immigrants | Portugal | 54.9 /100 | #168 | Average 11.1% |
| Immigrants | Colombia | 54.2 /100 | #169 | Average 11.1% |
Demographics Similar to Immigrants from Korea by Male Poverty
In terms of male poverty, the demographic groups most similar to Immigrants from Korea are Greek (9.7%, a difference of 0.040%), Danish (9.7%, a difference of 0.080%), Polish (9.7%, a difference of 0.12%), Tongan (9.7%, a difference of 0.14%), and Burmese (9.7%, a difference of 0.21%).
| Demographics | Rating | Rank | Male Poverty |
| Immigrants | Scotland | 99.7 /100 | #21 | Exceptional 9.6% |
| Croatians | 99.7 /100 | #22 | Exceptional 9.6% |
| Italians | 99.7 /100 | #23 | Exceptional 9.6% |
| Swedes | 99.7 /100 | #24 | Exceptional 9.6% |
| Eastern Europeans | 99.6 /100 | #25 | Exceptional 9.6% |
| Burmese | 99.6 /100 | #26 | Exceptional 9.7% |
| Danes | 99.6 /100 | #27 | Exceptional 9.7% |
| Immigrants | Korea | 99.6 /100 | #28 | Exceptional 9.7% |
| Greeks | 99.6 /100 | #29 | Exceptional 9.7% |
| Poles | 99.5 /100 | #30 | Exceptional 9.7% |
| Tongans | 99.5 /100 | #31 | Exceptional 9.7% |
| Macedonians | 99.5 /100 | #32 | Exceptional 9.7% |
| Immigrants | Northern Europe | 99.5 /100 | #33 | Exceptional 9.7% |
| Immigrants | Poland | 99.5 /100 | #34 | Exceptional 9.8% |
| Iranians | 99.4 /100 | #35 | Exceptional 9.8% |