Immigrants from Central America vs Blackfeet Female Poverty
COMPARE
Immigrants from Central America
Blackfeet
Female Poverty
Female Poverty Comparison
Immigrants from Central America
Blackfeet
16.8%
FEMALE POVERTY
0.0/ 100
METRIC RATING
304th/ 347
METRIC RANK
16.4%
FEMALE POVERTY
0.0/ 100
METRIC RATING
289th/ 347
METRIC RANK
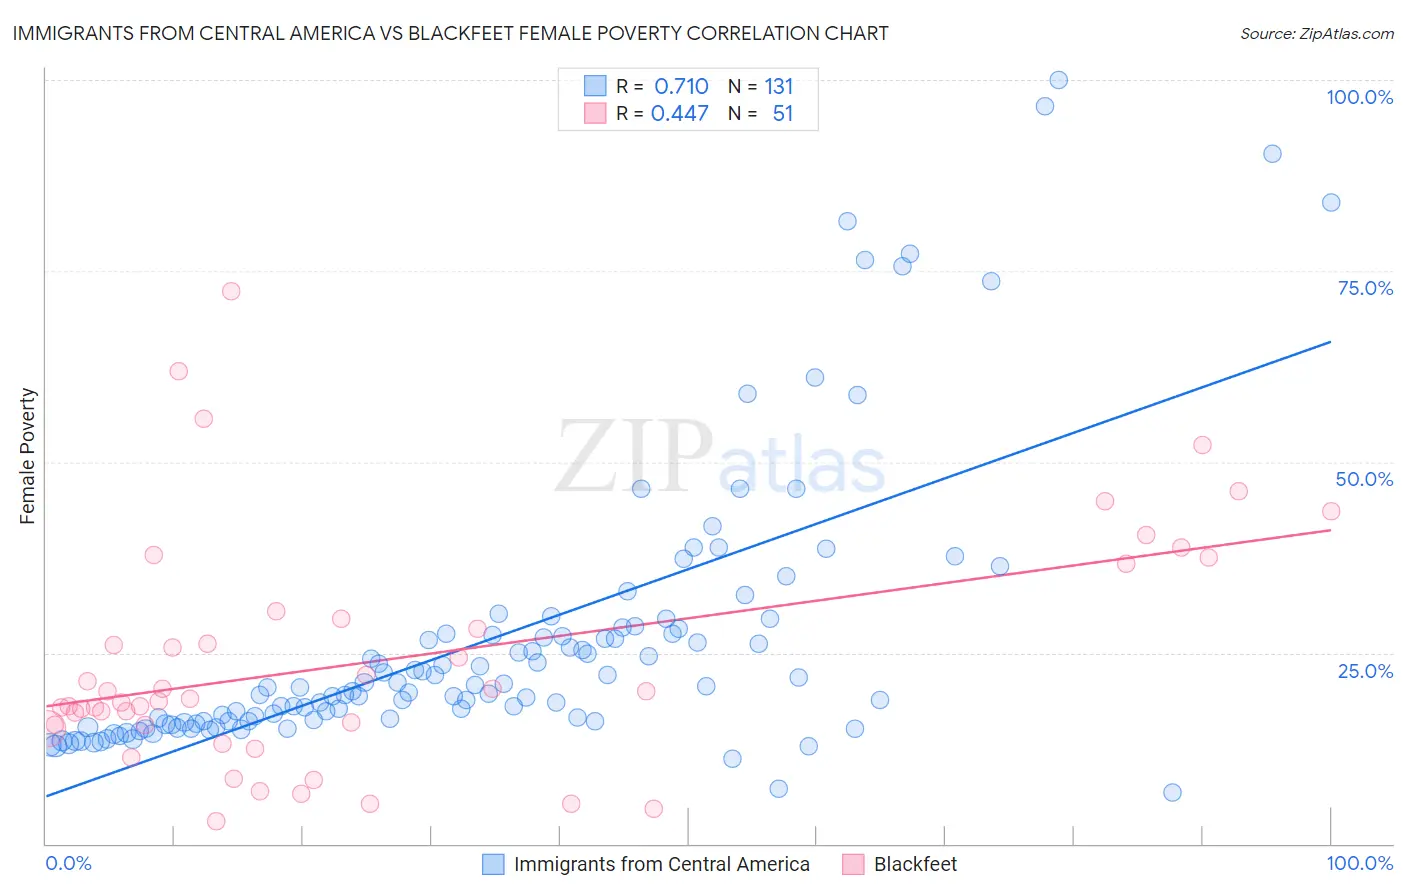
Immigrants from Central America vs Blackfeet Female Poverty Correlation Chart
The statistical analysis conducted on geographies consisting of 535,791,715 people shows a strong positive correlation between the proportion of Immigrants from Central America and poverty level among females in the United States with a correlation coefficient (R) of 0.710 and weighted average of 16.8%. Similarly, the statistical analysis conducted on geographies consisting of 309,450,114 people shows a moderate positive correlation between the proportion of Blackfeet and poverty level among females in the United States with a correlation coefficient (R) of 0.447 and weighted average of 16.4%, a difference of 2.8%.
Female Poverty Correlation Summary
| Measurement | Immigrants from Central America | Blackfeet |
| Minimum | 6.7% | 3.0% |
| Maximum | 100.0% | 72.4% |
| Range | 93.3% | 69.4% |
| Mean | 26.7% | 24.1% |
| Median | 20.4% | 19.0% |
| Interquartile 25% (IQ1) | 16.0% | 15.5% |
| Interquartile 75% (IQ3) | 27.6% | 30.4% |
| Interquartile Range (IQR) | 11.5% | 14.9% |
| Standard Deviation (Sample) | 18.5% | 15.4% |
| Standard Deviation (Population) | 18.4% | 15.2% |
Demographics Similar to Immigrants from Central America and Blackfeet by Female Poverty
In terms of female poverty, the demographic groups most similar to Immigrants from Central America are Immigrants from Grenada (16.8%, a difference of 0.0%), Choctaw (16.8%, a difference of 0.060%), Immigrants from Caribbean (16.9%, a difference of 0.27%), Chippewa (16.7%, a difference of 0.67%), and Guatemalan (16.7%, a difference of 0.70%). Similarly, the demographic groups most similar to Blackfeet are Indonesian (16.4%, a difference of 0.010%), Immigrants from Bangladesh (16.4%, a difference of 0.19%), Yaqui (16.4%, a difference of 0.36%), Immigrants from Zaire (16.4%, a difference of 0.37%), and Immigrants from Latin America (16.4%, a difference of 0.42%).
| Demographics | Rating | Rank | Female Poverty |
| Inupiat | 0.0 /100 | #286 | Tragic 16.2% |
| Immigrants | Belize | 0.0 /100 | #287 | Tragic 16.3% |
| Indonesians | 0.0 /100 | #288 | Tragic 16.4% |
| Blackfeet | 0.0 /100 | #289 | Tragic 16.4% |
| Immigrants | Bangladesh | 0.0 /100 | #290 | Tragic 16.4% |
| Yaqui | 0.0 /100 | #291 | Tragic 16.4% |
| Immigrants | Zaire | 0.0 /100 | #292 | Tragic 16.4% |
| Immigrants | Latin America | 0.0 /100 | #293 | Tragic 16.4% |
| Immigrants | Cabo Verde | 0.0 /100 | #294 | Tragic 16.4% |
| Senegalese | 0.0 /100 | #295 | Tragic 16.5% |
| Immigrants | Senegal | 0.0 /100 | #296 | Tragic 16.5% |
| Mexicans | 0.0 /100 | #297 | Tragic 16.5% |
| Somalis | 0.0 /100 | #298 | Tragic 16.6% |
| Hispanics or Latinos | 0.0 /100 | #299 | Tragic 16.6% |
| Bahamians | 0.0 /100 | #300 | Tragic 16.6% |
| Guatemalans | 0.0 /100 | #301 | Tragic 16.7% |
| Chippewa | 0.0 /100 | #302 | Tragic 16.7% |
| Choctaw | 0.0 /100 | #303 | Tragic 16.8% |
| Immigrants | Central America | 0.0 /100 | #304 | Tragic 16.8% |
| Immigrants | Grenada | 0.0 /100 | #305 | Tragic 16.8% |
| Immigrants | Caribbean | 0.0 /100 | #306 | Tragic 16.9% |