Eastern European vs Blackfeet Female Poverty
COMPARE
Eastern European
Blackfeet
Female Poverty
Female Poverty Comparison
Eastern Europeans
Blackfeet
11.5%
FEMALE POVERTY
99.7/ 100
METRIC RATING
20th/ 347
METRIC RANK
16.4%
FEMALE POVERTY
0.0/ 100
METRIC RATING
289th/ 347
METRIC RANK
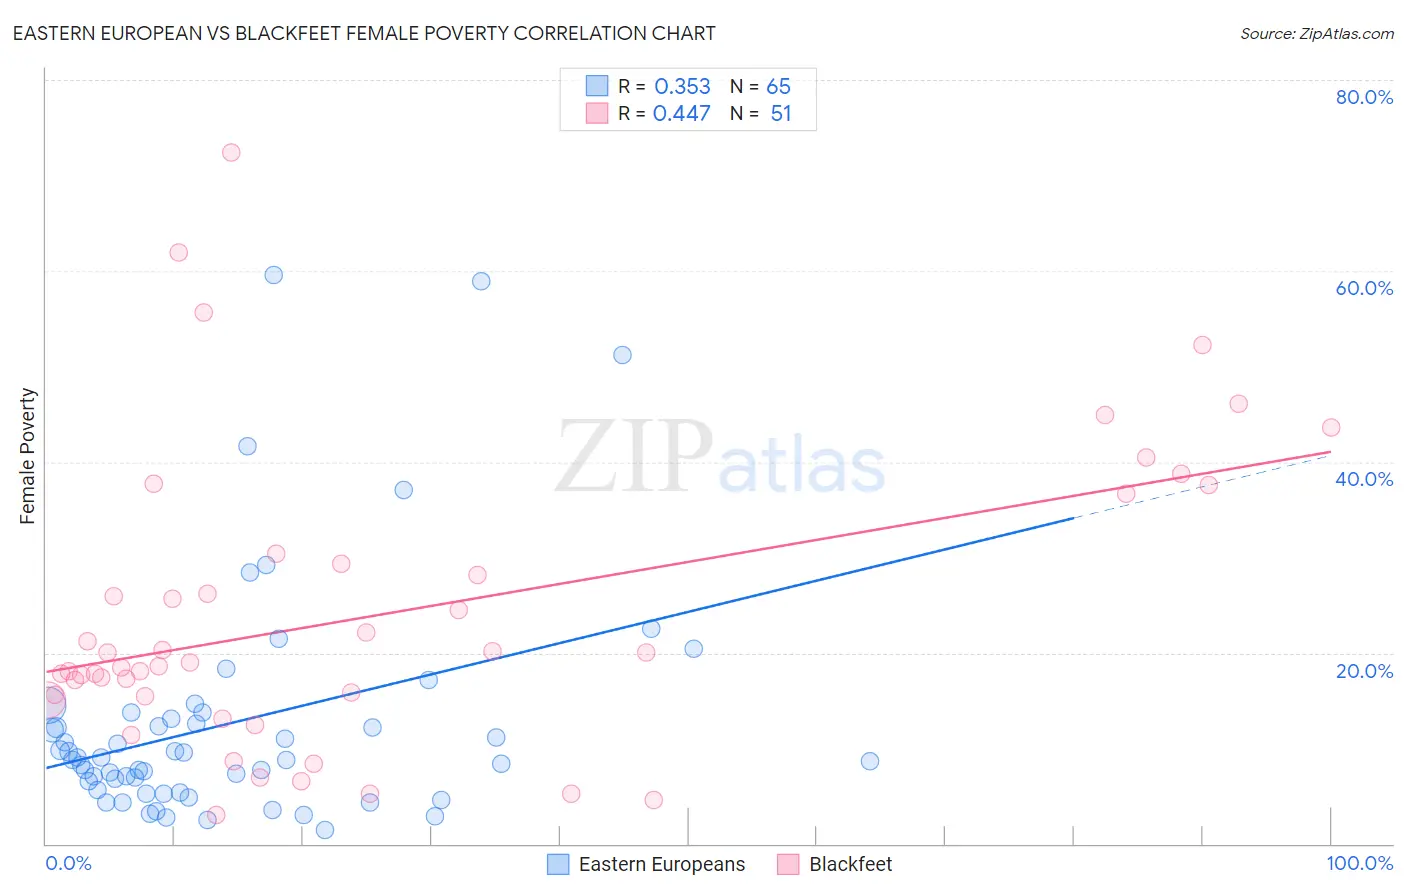
Eastern European vs Blackfeet Female Poverty Correlation Chart
The statistical analysis conducted on geographies consisting of 460,773,883 people shows a mild positive correlation between the proportion of Eastern Europeans and poverty level among females in the United States with a correlation coefficient (R) of 0.353 and weighted average of 11.5%. Similarly, the statistical analysis conducted on geographies consisting of 309,450,114 people shows a moderate positive correlation between the proportion of Blackfeet and poverty level among females in the United States with a correlation coefficient (R) of 0.447 and weighted average of 16.4%, a difference of 41.9%.
Female Poverty Correlation Summary
| Measurement | Eastern European | Blackfeet |
| Minimum | 1.4% | 3.0% |
| Maximum | 59.6% | 72.4% |
| Range | 58.2% | 69.4% |
| Mean | 12.7% | 24.1% |
| Median | 8.8% | 19.0% |
| Interquartile 25% (IQ1) | 5.5% | 15.5% |
| Interquartile 75% (IQ3) | 13.4% | 30.4% |
| Interquartile Range (IQR) | 7.9% | 14.9% |
| Standard Deviation (Sample) | 12.4% | 15.4% |
| Standard Deviation (Population) | 12.3% | 15.2% |
Similar Demographics by Female Poverty
Demographics Similar to Eastern Europeans by Female Poverty
In terms of female poverty, the demographic groups most similar to Eastern Europeans are Norwegian (11.5%, a difference of 0.23%), Immigrants from Scotland (11.5%, a difference of 0.27%), Bolivian (11.5%, a difference of 0.32%), Immigrants from Bolivia (11.5%, a difference of 0.39%), and Italian (11.6%, a difference of 0.50%).
| Demographics | Rating | Rank | Female Poverty |
| Immigrants | Lithuania | 99.9 /100 | #13 | Exceptional 11.3% |
| Lithuanians | 99.8 /100 | #14 | Exceptional 11.4% |
| Latvians | 99.8 /100 | #15 | Exceptional 11.4% |
| Immigrants | Bolivia | 99.8 /100 | #16 | Exceptional 11.5% |
| Bolivians | 99.8 /100 | #17 | Exceptional 11.5% |
| Immigrants | Scotland | 99.8 /100 | #18 | Exceptional 11.5% |
| Norwegians | 99.8 /100 | #19 | Exceptional 11.5% |
| Eastern Europeans | 99.7 /100 | #20 | Exceptional 11.5% |
| Italians | 99.7 /100 | #21 | Exceptional 11.6% |
| Swedes | 99.7 /100 | #22 | Exceptional 11.6% |
| Burmese | 99.7 /100 | #23 | Exceptional 11.6% |
| Luxembourgers | 99.7 /100 | #24 | Exceptional 11.6% |
| Immigrants | Northern Europe | 99.6 /100 | #25 | Exceptional 11.6% |
| Croatians | 99.6 /100 | #26 | Exceptional 11.6% |
| Iranians | 99.6 /100 | #27 | Exceptional 11.7% |
Demographics Similar to Blackfeet by Female Poverty
In terms of female poverty, the demographic groups most similar to Blackfeet are Indonesian (16.4%, a difference of 0.010%), Immigrants from Bangladesh (16.4%, a difference of 0.19%), Yaqui (16.4%, a difference of 0.36%), Immigrants from Zaire (16.4%, a difference of 0.37%), and Immigrants from Latin America (16.4%, a difference of 0.42%).
| Demographics | Rating | Rank | Female Poverty |
| Immigrants | Haiti | 0.0 /100 | #282 | Tragic 16.1% |
| Immigrants | Cuba | 0.0 /100 | #283 | Tragic 16.1% |
| Spanish Americans | 0.0 /100 | #284 | Tragic 16.2% |
| Comanche | 0.0 /100 | #285 | Tragic 16.2% |
| Inupiat | 0.0 /100 | #286 | Tragic 16.2% |
| Immigrants | Belize | 0.0 /100 | #287 | Tragic 16.3% |
| Indonesians | 0.0 /100 | #288 | Tragic 16.4% |
| Blackfeet | 0.0 /100 | #289 | Tragic 16.4% |
| Immigrants | Bangladesh | 0.0 /100 | #290 | Tragic 16.4% |
| Yaqui | 0.0 /100 | #291 | Tragic 16.4% |
| Immigrants | Zaire | 0.0 /100 | #292 | Tragic 16.4% |
| Immigrants | Latin America | 0.0 /100 | #293 | Tragic 16.4% |
| Immigrants | Cabo Verde | 0.0 /100 | #294 | Tragic 16.4% |
| Senegalese | 0.0 /100 | #295 | Tragic 16.5% |
| Immigrants | Senegal | 0.0 /100 | #296 | Tragic 16.5% |