Immigrants from Caribbean vs Immigrants from Italy Male Poverty
COMPARE
Immigrants from Caribbean
Immigrants from Italy
Male Poverty
Male Poverty Comparison
Immigrants from Caribbean
Immigrants from Italy
14.0%
MALE POVERTY
0.0/ 100
METRIC RATING
302nd/ 347
METRIC RANK
10.2%
MALE POVERTY
97.8/ 100
METRIC RATING
62nd/ 347
METRIC RANK
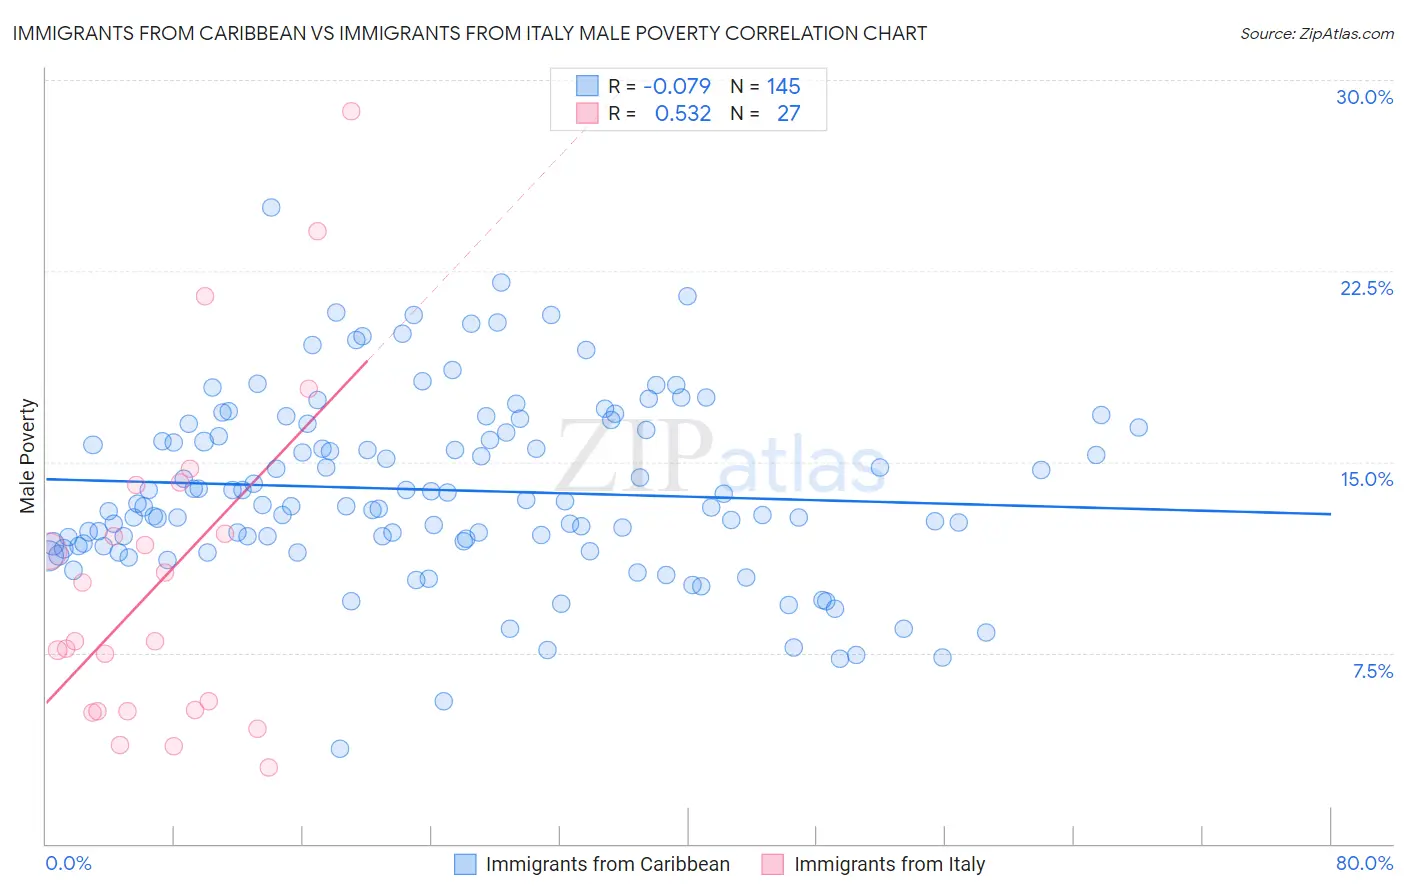
Immigrants from Caribbean vs Immigrants from Italy Male Poverty Correlation Chart
The statistical analysis conducted on geographies consisting of 449,415,069 people shows a slight negative correlation between the proportion of Immigrants from Caribbean and poverty level among males in the United States with a correlation coefficient (R) of -0.079 and weighted average of 14.0%. Similarly, the statistical analysis conducted on geographies consisting of 324,012,944 people shows a substantial positive correlation between the proportion of Immigrants from Italy and poverty level among males in the United States with a correlation coefficient (R) of 0.532 and weighted average of 10.2%, a difference of 38.4%.
Male Poverty Correlation Summary
| Measurement | Immigrants from Caribbean | Immigrants from Italy |
| Minimum | 3.7% | 3.0% |
| Maximum | 25.0% | 28.8% |
| Range | 21.3% | 25.8% |
| Mean | 13.9% | 10.5% |
| Median | 13.3% | 8.0% |
| Interquartile 25% (IQ1) | 11.8% | 5.2% |
| Interquartile 75% (IQ3) | 16.3% | 14.1% |
| Interquartile Range (IQR) | 4.5% | 8.9% |
| Standard Deviation (Sample) | 3.5% | 6.5% |
| Standard Deviation (Population) | 3.5% | 6.4% |
Similar Demographics by Male Poverty
Demographics Similar to Immigrants from Caribbean by Male Poverty
In terms of male poverty, the demographic groups most similar to Immigrants from Caribbean are Bahamian (14.1%, a difference of 0.040%), Immigrants from Senegal (14.0%, a difference of 0.060%), Immigrants from Mexico (14.0%, a difference of 0.13%), Senegalese (14.1%, a difference of 0.14%), and Immigrants from Guatemala (14.0%, a difference of 0.24%).
| Demographics | Rating | Rank | Male Poverty |
| Immigrants | Central America | 0.0 /100 | #295 | Tragic 13.9% |
| Cajuns | 0.0 /100 | #296 | Tragic 13.9% |
| Inupiat | 0.0 /100 | #297 | Tragic 14.0% |
| Blackfeet | 0.0 /100 | #298 | Tragic 14.0% |
| Immigrants | Guatemala | 0.0 /100 | #299 | Tragic 14.0% |
| Immigrants | Mexico | 0.0 /100 | #300 | Tragic 14.0% |
| Immigrants | Senegal | 0.0 /100 | #301 | Tragic 14.0% |
| Immigrants | Caribbean | 0.0 /100 | #302 | Tragic 14.0% |
| Bahamians | 0.0 /100 | #303 | Tragic 14.1% |
| Senegalese | 0.0 /100 | #304 | Tragic 14.1% |
| Immigrants | Bangladesh | 0.0 /100 | #305 | Tragic 14.1% |
| Creek | 0.0 /100 | #306 | Tragic 14.1% |
| Dutch West Indians | 0.0 /100 | #307 | Tragic 14.2% |
| Africans | 0.0 /100 | #308 | Tragic 14.2% |
| Somalis | 0.0 /100 | #309 | Tragic 14.3% |
Demographics Similar to Immigrants from Italy by Male Poverty
In terms of male poverty, the demographic groups most similar to Immigrants from Italy are Slovak (10.2%, a difference of 0.040%), Austrian (10.1%, a difference of 0.090%), Ukrainian (10.1%, a difference of 0.11%), Immigrants from Europe (10.1%, a difference of 0.20%), and Swiss (10.2%, a difference of 0.28%).
| Demographics | Rating | Rank | Male Poverty |
| Germans | 98.3 /100 | #55 | Exceptional 10.1% |
| Immigrants | Bulgaria | 98.2 /100 | #56 | Exceptional 10.1% |
| Estonians | 98.1 /100 | #57 | Exceptional 10.1% |
| Scandinavians | 98.0 /100 | #58 | Exceptional 10.1% |
| Immigrants | Europe | 97.9 /100 | #59 | Exceptional 10.1% |
| Ukrainians | 97.9 /100 | #60 | Exceptional 10.1% |
| Austrians | 97.8 /100 | #61 | Exceptional 10.1% |
| Immigrants | Italy | 97.8 /100 | #62 | Exceptional 10.2% |
| Slovaks | 97.7 /100 | #63 | Exceptional 10.2% |
| Swiss | 97.5 /100 | #64 | Exceptional 10.2% |
| Zimbabweans | 97.5 /100 | #65 | Exceptional 10.2% |
| Serbians | 97.5 /100 | #66 | Exceptional 10.2% |
| Immigrants | Netherlands | 97.3 /100 | #67 | Exceptional 10.2% |
| Immigrants | Sri Lanka | 97.2 /100 | #68 | Exceptional 10.2% |
| Immigrants | Australia | 97.1 /100 | #69 | Exceptional 10.2% |