Immigrants from Caribbean vs Polish Male Poverty
COMPARE
Immigrants from Caribbean
Polish
Male Poverty
Male Poverty Comparison
Immigrants from Caribbean
Poles
14.0%
MALE POVERTY
0.0/ 100
METRIC RATING
302nd/ 347
METRIC RANK
9.7%
MALE POVERTY
99.5/ 100
METRIC RATING
30th/ 347
METRIC RANK
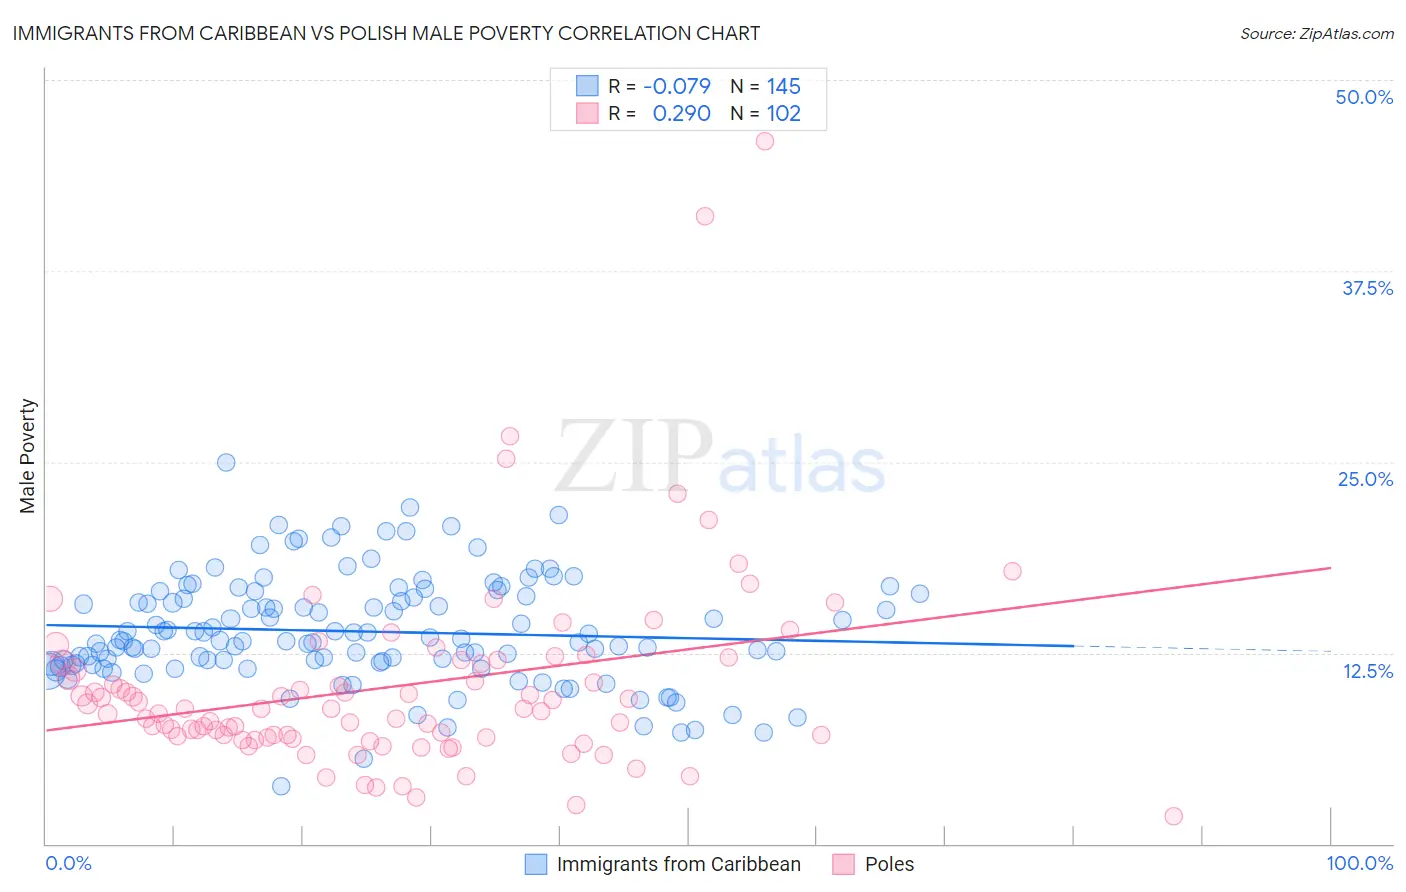
Immigrants from Caribbean vs Polish Male Poverty Correlation Chart
The statistical analysis conducted on geographies consisting of 449,415,069 people shows a slight negative correlation between the proportion of Immigrants from Caribbean and poverty level among males in the United States with a correlation coefficient (R) of -0.079 and weighted average of 14.0%. Similarly, the statistical analysis conducted on geographies consisting of 558,970,133 people shows a weak positive correlation between the proportion of Poles and poverty level among males in the United States with a correlation coefficient (R) of 0.290 and weighted average of 9.7%, a difference of 44.6%.
Male Poverty Correlation Summary
| Measurement | Immigrants from Caribbean | Polish |
| Minimum | 3.7% | 1.8% |
| Maximum | 25.0% | 46.0% |
| Range | 21.3% | 44.2% |
| Mean | 13.9% | 10.3% |
| Median | 13.3% | 8.8% |
| Interquartile 25% (IQ1) | 11.8% | 7.0% |
| Interquartile 75% (IQ3) | 16.3% | 11.9% |
| Interquartile Range (IQR) | 4.5% | 4.9% |
| Standard Deviation (Sample) | 3.5% | 6.5% |
| Standard Deviation (Population) | 3.5% | 6.5% |
Similar Demographics by Male Poverty
Demographics Similar to Immigrants from Caribbean by Male Poverty
In terms of male poverty, the demographic groups most similar to Immigrants from Caribbean are Bahamian (14.1%, a difference of 0.040%), Immigrants from Senegal (14.0%, a difference of 0.060%), Immigrants from Mexico (14.0%, a difference of 0.13%), Senegalese (14.1%, a difference of 0.14%), and Immigrants from Guatemala (14.0%, a difference of 0.24%).
| Demographics | Rating | Rank | Male Poverty |
| Immigrants | Central America | 0.0 /100 | #295 | Tragic 13.9% |
| Cajuns | 0.0 /100 | #296 | Tragic 13.9% |
| Inupiat | 0.0 /100 | #297 | Tragic 14.0% |
| Blackfeet | 0.0 /100 | #298 | Tragic 14.0% |
| Immigrants | Guatemala | 0.0 /100 | #299 | Tragic 14.0% |
| Immigrants | Mexico | 0.0 /100 | #300 | Tragic 14.0% |
| Immigrants | Senegal | 0.0 /100 | #301 | Tragic 14.0% |
| Immigrants | Caribbean | 0.0 /100 | #302 | Tragic 14.0% |
| Bahamians | 0.0 /100 | #303 | Tragic 14.1% |
| Senegalese | 0.0 /100 | #304 | Tragic 14.1% |
| Immigrants | Bangladesh | 0.0 /100 | #305 | Tragic 14.1% |
| Creek | 0.0 /100 | #306 | Tragic 14.1% |
| Dutch West Indians | 0.0 /100 | #307 | Tragic 14.2% |
| Africans | 0.0 /100 | #308 | Tragic 14.2% |
| Somalis | 0.0 /100 | #309 | Tragic 14.3% |
Demographics Similar to Poles by Male Poverty
In terms of male poverty, the demographic groups most similar to Poles are Tongan (9.7%, a difference of 0.020%), Greek (9.7%, a difference of 0.080%), Immigrants from Korea (9.7%, a difference of 0.12%), Danish (9.7%, a difference of 0.20%), and Macedonian (9.7%, a difference of 0.23%).
| Demographics | Rating | Rank | Male Poverty |
| Italians | 99.7 /100 | #23 | Exceptional 9.6% |
| Swedes | 99.7 /100 | #24 | Exceptional 9.6% |
| Eastern Europeans | 99.6 /100 | #25 | Exceptional 9.6% |
| Burmese | 99.6 /100 | #26 | Exceptional 9.7% |
| Danes | 99.6 /100 | #27 | Exceptional 9.7% |
| Immigrants | Korea | 99.6 /100 | #28 | Exceptional 9.7% |
| Greeks | 99.6 /100 | #29 | Exceptional 9.7% |
| Poles | 99.5 /100 | #30 | Exceptional 9.7% |
| Tongans | 99.5 /100 | #31 | Exceptional 9.7% |
| Macedonians | 99.5 /100 | #32 | Exceptional 9.7% |
| Immigrants | Northern Europe | 99.5 /100 | #33 | Exceptional 9.7% |
| Immigrants | Poland | 99.5 /100 | #34 | Exceptional 9.8% |
| Iranians | 99.4 /100 | #35 | Exceptional 9.8% |
| Czechs | 99.4 /100 | #36 | Exceptional 9.8% |
| Immigrants | Greece | 99.3 /100 | #37 | Exceptional 9.8% |