Immigrants from Caribbean vs Armenian Seniors Poverty Over the Age of 65
COMPARE
Immigrants from Caribbean
Armenian
Seniors Poverty Over the Age of 65
Seniors Poverty Over the Age of 65 Comparison
Immigrants from Caribbean
Armenians
16.5%
SENIORS POVERTY OVER THE AGE OF 65
0.0/ 100
METRIC RATING
337th/ 347
METRIC RANK
12.3%
SENIORS POVERTY OVER THE AGE OF 65
0.3/ 100
METRIC RATING
252nd/ 347
METRIC RANK
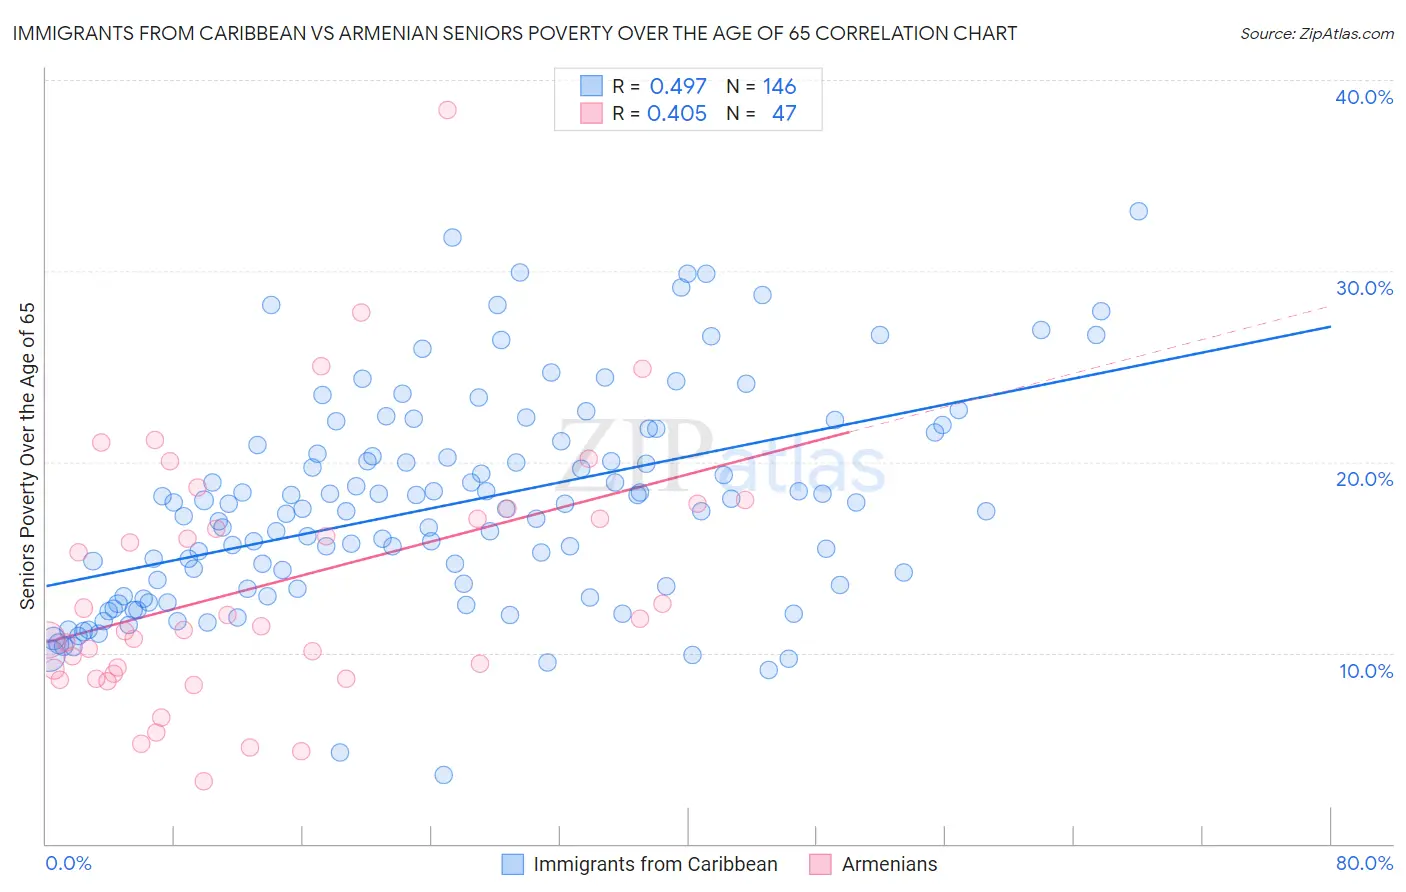
Immigrants from Caribbean vs Armenian Seniors Poverty Over the Age of 65 Correlation Chart
The statistical analysis conducted on geographies consisting of 447,867,383 people shows a moderate positive correlation between the proportion of Immigrants from Caribbean and poverty level among seniors over the age of 65 in the United States with a correlation coefficient (R) of 0.497 and weighted average of 16.5%. Similarly, the statistical analysis conducted on geographies consisting of 310,185,969 people shows a moderate positive correlation between the proportion of Armenians and poverty level among seniors over the age of 65 in the United States with a correlation coefficient (R) of 0.405 and weighted average of 12.3%, a difference of 33.9%.
Seniors Poverty Over the Age of 65 Correlation Summary
| Measurement | Immigrants from Caribbean | Armenian |
| Minimum | 3.6% | 3.3% |
| Maximum | 33.2% | 38.5% |
| Range | 29.5% | 35.2% |
| Mean | 17.7% | 13.6% |
| Median | 17.5% | 11.4% |
| Interquartile 25% (IQ1) | 13.4% | 8.9% |
| Interquartile 75% (IQ3) | 20.9% | 17.6% |
| Interquartile Range (IQR) | 7.5% | 8.7% |
| Standard Deviation (Sample) | 5.6% | 6.8% |
| Standard Deviation (Population) | 5.6% | 6.7% |
Similar Demographics by Seniors Poverty Over the Age of 65
Demographics Similar to Immigrants from Caribbean by Seniors Poverty Over the Age of 65
In terms of seniors poverty over the age of 65, the demographic groups most similar to Immigrants from Caribbean are Immigrants from Cabo Verde (16.2%, a difference of 1.8%), Cuban (16.1%, a difference of 2.4%), Immigrants from Nicaragua (15.9%, a difference of 3.7%), Immigrants from Yemen (15.9%, a difference of 3.9%), and Pueblo (17.2%, a difference of 4.2%).
| Demographics | Rating | Rank | Seniors Poverty Over the Age of 65 |
| Immigrants | St. Vincent and the Grenadines | 0.0 /100 | #330 | Tragic 15.5% |
| British West Indians | 0.0 /100 | #331 | Tragic 15.6% |
| Immigrants | Grenada | 0.0 /100 | #332 | Tragic 15.8% |
| Immigrants | Yemen | 0.0 /100 | #333 | Tragic 15.9% |
| Immigrants | Nicaragua | 0.0 /100 | #334 | Tragic 15.9% |
| Cubans | 0.0 /100 | #335 | Tragic 16.1% |
| Immigrants | Cabo Verde | 0.0 /100 | #336 | Tragic 16.2% |
| Immigrants | Caribbean | 0.0 /100 | #337 | Tragic 16.5% |
| Pueblo | 0.0 /100 | #338 | Tragic 17.2% |
| Navajo | 0.0 /100 | #339 | Tragic 17.5% |
| Hopi | 0.0 /100 | #340 | Tragic 17.8% |
| Dominicans | 0.0 /100 | #341 | Tragic 17.8% |
| Immigrants | Cuba | 0.0 /100 | #342 | Tragic 17.9% |
| Lumbee | 0.0 /100 | #343 | Tragic 18.1% |
| Immigrants | Dominican Republic | 0.0 /100 | #344 | Tragic 18.3% |
Demographics Similar to Armenians by Seniors Poverty Over the Age of 65
In terms of seniors poverty over the age of 65, the demographic groups most similar to Armenians are Somali (12.3%, a difference of 0.11%), Shoshone (12.3%, a difference of 0.13%), Immigrants from Cambodia (12.4%, a difference of 0.35%), Mexican American Indian (12.4%, a difference of 0.48%), and Immigrants from Panama (12.4%, a difference of 0.71%).
| Demographics | Rating | Rank | Seniors Poverty Over the Age of 65 |
| Chippewa | 0.7 /100 | #245 | Tragic 12.1% |
| Cree | 0.7 /100 | #246 | Tragic 12.1% |
| Japanese | 0.6 /100 | #247 | Tragic 12.2% |
| Spanish Americans | 0.6 /100 | #248 | Tragic 12.2% |
| Ute | 0.6 /100 | #249 | Tragic 12.2% |
| Immigrants | Liberia | 0.5 /100 | #250 | Tragic 12.2% |
| Somalis | 0.3 /100 | #251 | Tragic 12.3% |
| Armenians | 0.3 /100 | #252 | Tragic 12.3% |
| Shoshone | 0.3 /100 | #253 | Tragic 12.3% |
| Immigrants | Cambodia | 0.3 /100 | #254 | Tragic 12.4% |
| Mexican American Indians | 0.3 /100 | #255 | Tragic 12.4% |
| Immigrants | Panama | 0.2 /100 | #256 | Tragic 12.4% |
| Immigrants | Immigrants | 0.2 /100 | #257 | Tragic 12.4% |
| Dutch West Indians | 0.2 /100 | #258 | Tragic 12.4% |
| Ghanaians | 0.2 /100 | #259 | Tragic 12.4% |