Immigrants from Cameroon vs Subsaharan African Single Male Poverty
COMPARE
Immigrants from Cameroon
Subsaharan African
Single Male Poverty
Single Male Poverty Comparison
Immigrants from Cameroon
Sub-Saharan Africans
11.5%
SINGLE MALE POVERTY
99.9/ 100
METRIC RATING
44th/ 347
METRIC RANK
13.7%
SINGLE MALE POVERTY
0.5/ 100
METRIC RATING
254th/ 347
METRIC RANK
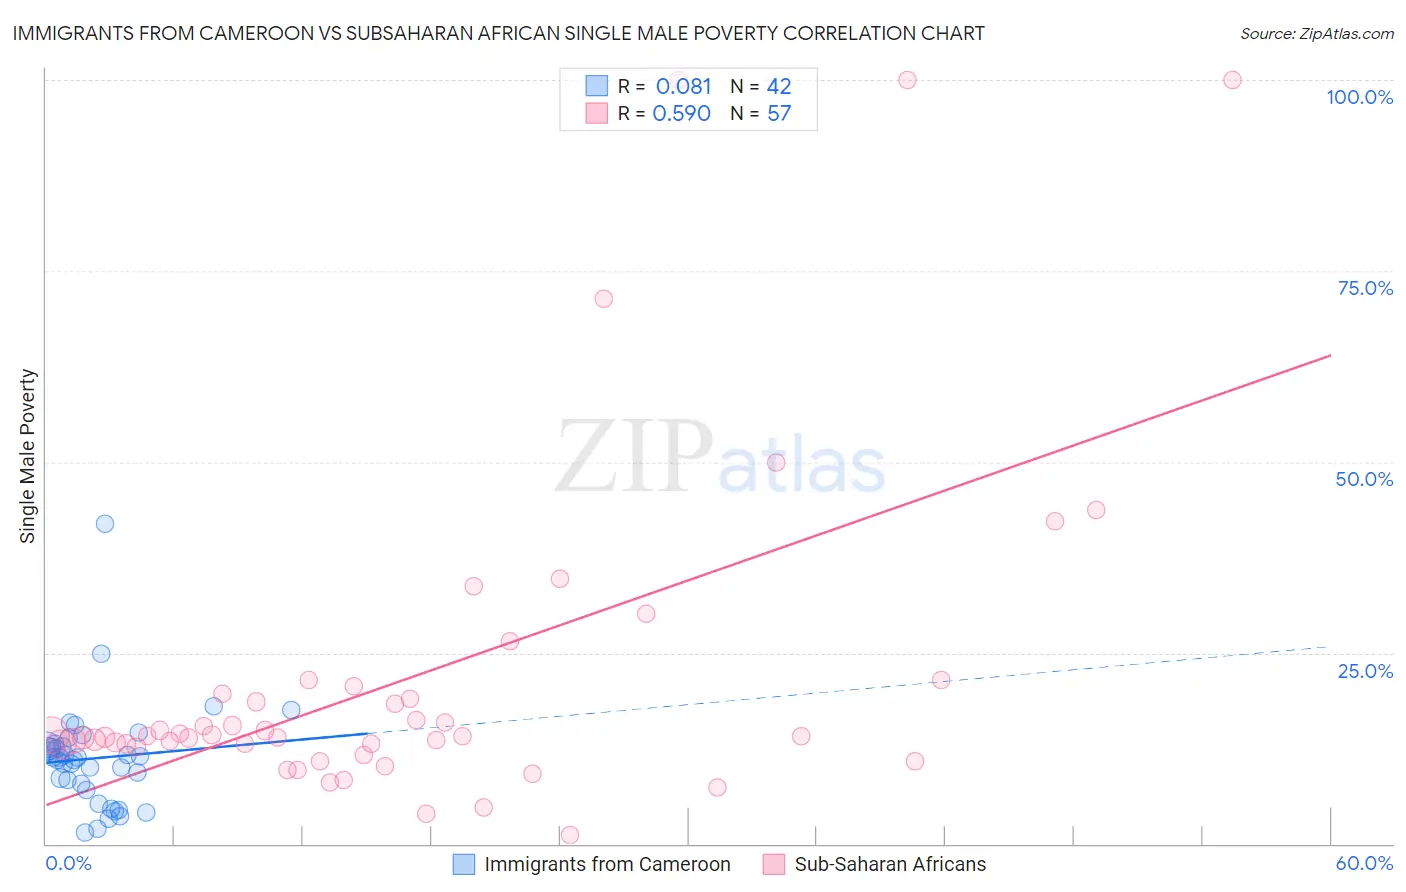
Immigrants from Cameroon vs Subsaharan African Single Male Poverty Correlation Chart
The statistical analysis conducted on geographies consisting of 124,431,702 people shows a slight positive correlation between the proportion of Immigrants from Cameroon and poverty level among single males in the United States with a correlation coefficient (R) of 0.081 and weighted average of 11.5%. Similarly, the statistical analysis conducted on geographies consisting of 440,120,617 people shows a substantial positive correlation between the proportion of Sub-Saharan Africans and poverty level among single males in the United States with a correlation coefficient (R) of 0.590 and weighted average of 13.7%, a difference of 18.6%.
Single Male Poverty Correlation Summary
| Measurement | Immigrants from Cameroon | Subsaharan African |
| Minimum | 1.5% | 1.1% |
| Maximum | 41.9% | 100.0% |
| Range | 40.4% | 98.9% |
| Mean | 11.2% | 21.8% |
| Median | 11.3% | 14.1% |
| Interquartile 25% (IQ1) | 7.8% | 12.8% |
| Interquartile 75% (IQ3) | 12.8% | 20.1% |
| Interquartile Range (IQR) | 5.0% | 7.3% |
| Standard Deviation (Sample) | 6.8% | 22.0% |
| Standard Deviation (Population) | 6.7% | 21.8% |
Similar Demographics by Single Male Poverty
Demographics Similar to Immigrants from Cameroon by Single Male Poverty
In terms of single male poverty, the demographic groups most similar to Immigrants from Cameroon are Immigrants from Peru (11.5%, a difference of 0.010%), Immigrants from Poland (11.5%, a difference of 0.020%), Immigrants from Bulgaria (11.6%, a difference of 0.15%), Egyptian (11.5%, a difference of 0.17%), and Immigrants from Iraq (11.5%, a difference of 0.22%).
| Demographics | Rating | Rank | Single Male Poverty |
| Immigrants | Singapore | 100.0 /100 | #37 | Exceptional 11.4% |
| Sri Lankans | 100.0 /100 | #38 | Exceptional 11.5% |
| Soviet Union | 100.0 /100 | #39 | Exceptional 11.5% |
| Immigrants | Korea | 100.0 /100 | #40 | Exceptional 11.5% |
| Immigrants | Iraq | 99.9 /100 | #41 | Exceptional 11.5% |
| Egyptians | 99.9 /100 | #42 | Exceptional 11.5% |
| Immigrants | Peru | 99.9 /100 | #43 | Exceptional 11.5% |
| Immigrants | Cameroon | 99.9 /100 | #44 | Exceptional 11.5% |
| Immigrants | Poland | 99.9 /100 | #45 | Exceptional 11.5% |
| Immigrants | Bulgaria | 99.9 /100 | #46 | Exceptional 11.6% |
| Nepalese | 99.9 /100 | #47 | Exceptional 11.6% |
| Immigrants | Indonesia | 99.9 /100 | #48 | Exceptional 11.6% |
| Tlingit-Haida | 99.9 /100 | #49 | Exceptional 11.6% |
| Immigrants | Lithuania | 99.9 /100 | #50 | Exceptional 11.6% |
| Paraguayans | 99.9 /100 | #51 | Exceptional 11.6% |
Demographics Similar to Sub-Saharan Africans by Single Male Poverty
In terms of single male poverty, the demographic groups most similar to Sub-Saharan Africans are Spaniard (13.7%, a difference of 0.11%), Immigrants from Belize (13.7%, a difference of 0.21%), Immigrants from Central America (13.8%, a difference of 0.40%), Immigrants from Guatemala (13.8%, a difference of 0.47%), and Guatemalan (13.8%, a difference of 0.51%).
| Demographics | Rating | Rank | Single Male Poverty |
| Belgians | 1.2 /100 | #247 | Tragic 13.5% |
| Czechs | 1.2 /100 | #248 | Tragic 13.5% |
| Spanish | 1.0 /100 | #249 | Tragic 13.6% |
| Immigrants | Somalia | 1.0 /100 | #250 | Tragic 13.6% |
| Immigrants | Zaire | 0.9 /100 | #251 | Tragic 13.6% |
| Finns | 0.9 /100 | #252 | Tragic 13.6% |
| German Russians | 0.8 /100 | #253 | Tragic 13.6% |
| Sub-Saharan Africans | 0.5 /100 | #254 | Tragic 13.7% |
| Spaniards | 0.4 /100 | #255 | Tragic 13.7% |
| Immigrants | Belize | 0.4 /100 | #256 | Tragic 13.7% |
| Immigrants | Central America | 0.3 /100 | #257 | Tragic 13.8% |
| Immigrants | Guatemala | 0.3 /100 | #258 | Tragic 13.8% |
| Guatemalans | 0.3 /100 | #259 | Tragic 13.8% |
| Swiss | 0.3 /100 | #260 | Tragic 13.8% |
| Hungarians | 0.3 /100 | #261 | Tragic 13.8% |