Immigrants from Cameroon vs Immigrants from Jordan Single Male Poverty
COMPARE
Immigrants from Cameroon
Immigrants from Jordan
Single Male Poverty
Single Male Poverty Comparison
Immigrants from Cameroon
Immigrants from Jordan
11.5%
SINGLE MALE POVERTY
99.9/ 100
METRIC RATING
44th/ 347
METRIC RANK
12.5%
SINGLE MALE POVERTY
87.1/ 100
METRIC RATING
125th/ 347
METRIC RANK
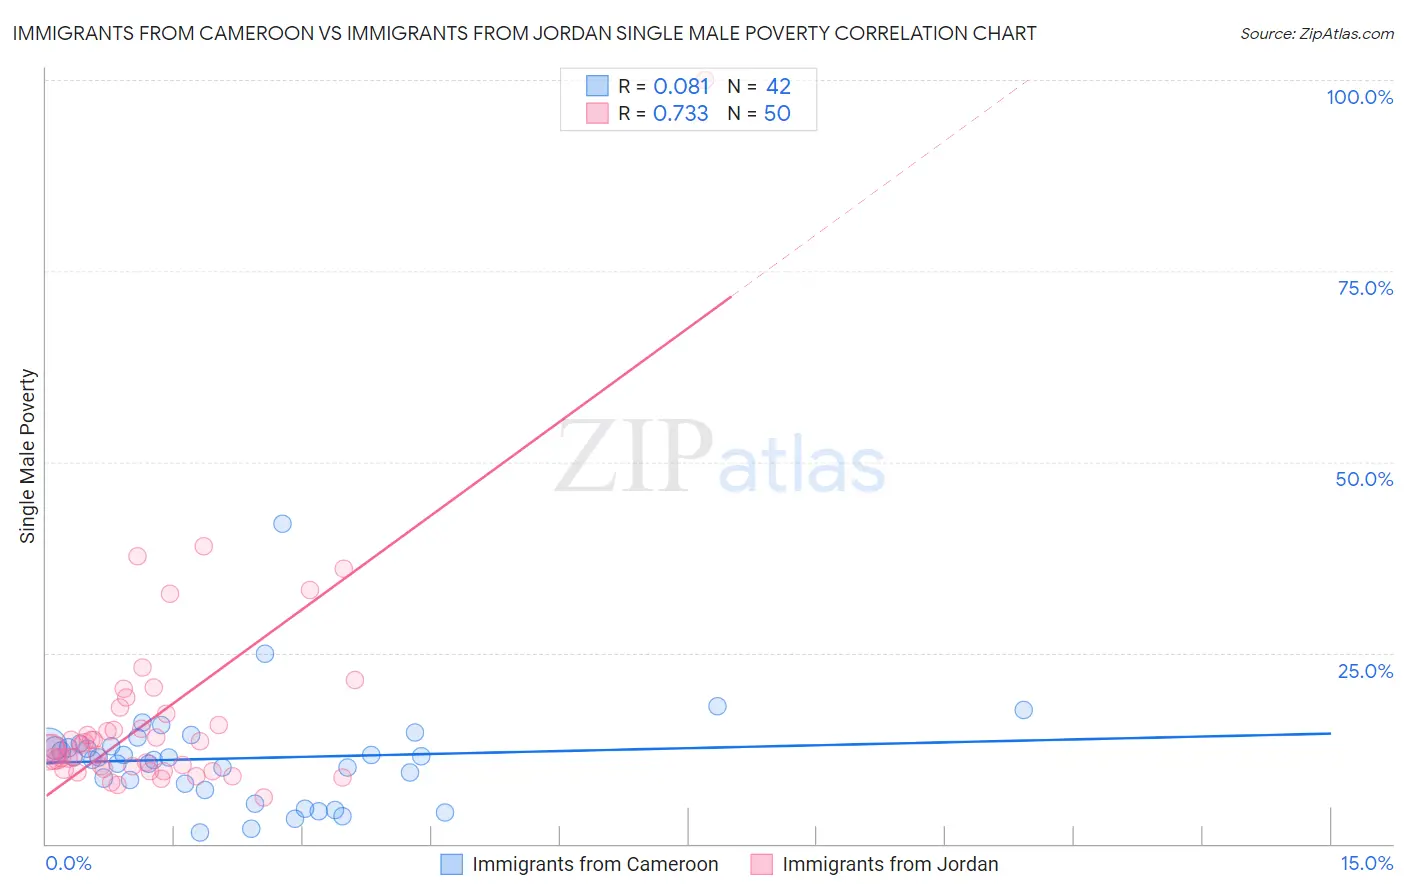
Immigrants from Cameroon vs Immigrants from Jordan Single Male Poverty Correlation Chart
The statistical analysis conducted on geographies consisting of 124,431,702 people shows a slight positive correlation between the proportion of Immigrants from Cameroon and poverty level among single males in the United States with a correlation coefficient (R) of 0.081 and weighted average of 11.5%. Similarly, the statistical analysis conducted on geographies consisting of 169,036,341 people shows a strong positive correlation between the proportion of Immigrants from Jordan and poverty level among single males in the United States with a correlation coefficient (R) of 0.733 and weighted average of 12.5%, a difference of 8.1%.
Single Male Poverty Correlation Summary
| Measurement | Immigrants from Cameroon | Immigrants from Jordan |
| Minimum | 1.5% | 6.0% |
| Maximum | 41.9% | 100.0% |
| Range | 40.4% | 94.0% |
| Mean | 11.2% | 16.7% |
| Median | 11.3% | 12.8% |
| Interquartile 25% (IQ1) | 7.8% | 9.7% |
| Interquartile 75% (IQ3) | 12.8% | 17.1% |
| Interquartile Range (IQR) | 5.0% | 7.3% |
| Standard Deviation (Sample) | 6.8% | 14.4% |
| Standard Deviation (Population) | 6.7% | 14.3% |
Similar Demographics by Single Male Poverty
Demographics Similar to Immigrants from Cameroon by Single Male Poverty
In terms of single male poverty, the demographic groups most similar to Immigrants from Cameroon are Immigrants from Peru (11.5%, a difference of 0.010%), Immigrants from Poland (11.5%, a difference of 0.020%), Immigrants from Bulgaria (11.6%, a difference of 0.15%), Egyptian (11.5%, a difference of 0.17%), and Immigrants from Iraq (11.5%, a difference of 0.22%).
| Demographics | Rating | Rank | Single Male Poverty |
| Immigrants | Singapore | 100.0 /100 | #37 | Exceptional 11.4% |
| Sri Lankans | 100.0 /100 | #38 | Exceptional 11.5% |
| Soviet Union | 100.0 /100 | #39 | Exceptional 11.5% |
| Immigrants | Korea | 100.0 /100 | #40 | Exceptional 11.5% |
| Immigrants | Iraq | 99.9 /100 | #41 | Exceptional 11.5% |
| Egyptians | 99.9 /100 | #42 | Exceptional 11.5% |
| Immigrants | Peru | 99.9 /100 | #43 | Exceptional 11.5% |
| Immigrants | Cameroon | 99.9 /100 | #44 | Exceptional 11.5% |
| Immigrants | Poland | 99.9 /100 | #45 | Exceptional 11.5% |
| Immigrants | Bulgaria | 99.9 /100 | #46 | Exceptional 11.6% |
| Nepalese | 99.9 /100 | #47 | Exceptional 11.6% |
| Immigrants | Indonesia | 99.9 /100 | #48 | Exceptional 11.6% |
| Tlingit-Haida | 99.9 /100 | #49 | Exceptional 11.6% |
| Immigrants | Lithuania | 99.9 /100 | #50 | Exceptional 11.6% |
| Paraguayans | 99.9 /100 | #51 | Exceptional 11.6% |
Demographics Similar to Immigrants from Jordan by Single Male Poverty
In terms of single male poverty, the demographic groups most similar to Immigrants from Jordan are Russian (12.5%, a difference of 0.030%), Immigrants from Kenya (12.5%, a difference of 0.060%), Romanian (12.5%, a difference of 0.080%), Serbian (12.5%, a difference of 0.10%), and Immigrants from Netherlands (12.5%, a difference of 0.10%).
| Demographics | Rating | Rank | Single Male Poverty |
| Albanians | 90.6 /100 | #118 | Exceptional 12.4% |
| Immigrants | Albania | 90.3 /100 | #119 | Exceptional 12.4% |
| Venezuelans | 89.4 /100 | #120 | Excellent 12.4% |
| Icelanders | 88.2 /100 | #121 | Excellent 12.5% |
| Serbians | 87.9 /100 | #122 | Excellent 12.5% |
| Immigrants | Kenya | 87.6 /100 | #123 | Excellent 12.5% |
| Russians | 87.3 /100 | #124 | Excellent 12.5% |
| Immigrants | Jordan | 87.1 /100 | #125 | Excellent 12.5% |
| Romanians | 86.4 /100 | #126 | Excellent 12.5% |
| Immigrants | Netherlands | 86.2 /100 | #127 | Excellent 12.5% |
| Ecuadorians | 85.9 /100 | #128 | Excellent 12.5% |
| Immigrants | Sierra Leone | 85.5 /100 | #129 | Excellent 12.5% |
| Immigrants | Nicaragua | 84.8 /100 | #130 | Excellent 12.5% |
| Immigrants | Northern Europe | 83.7 /100 | #131 | Excellent 12.5% |
| Salvadorans | 83.7 /100 | #132 | Excellent 12.5% |