Immigrants from Cameroon vs Subsaharan African 8th Grade
COMPARE
Immigrants from Cameroon
Subsaharan African
8th Grade
8th Grade Comparison
Immigrants from Cameroon
Sub-Saharan Africans
95.0%
8TH GRADE
0.8/ 100
METRIC RATING
254th/ 347
METRIC RANK
95.3%
8TH GRADE
6.0/ 100
METRIC RATING
225th/ 347
METRIC RANK
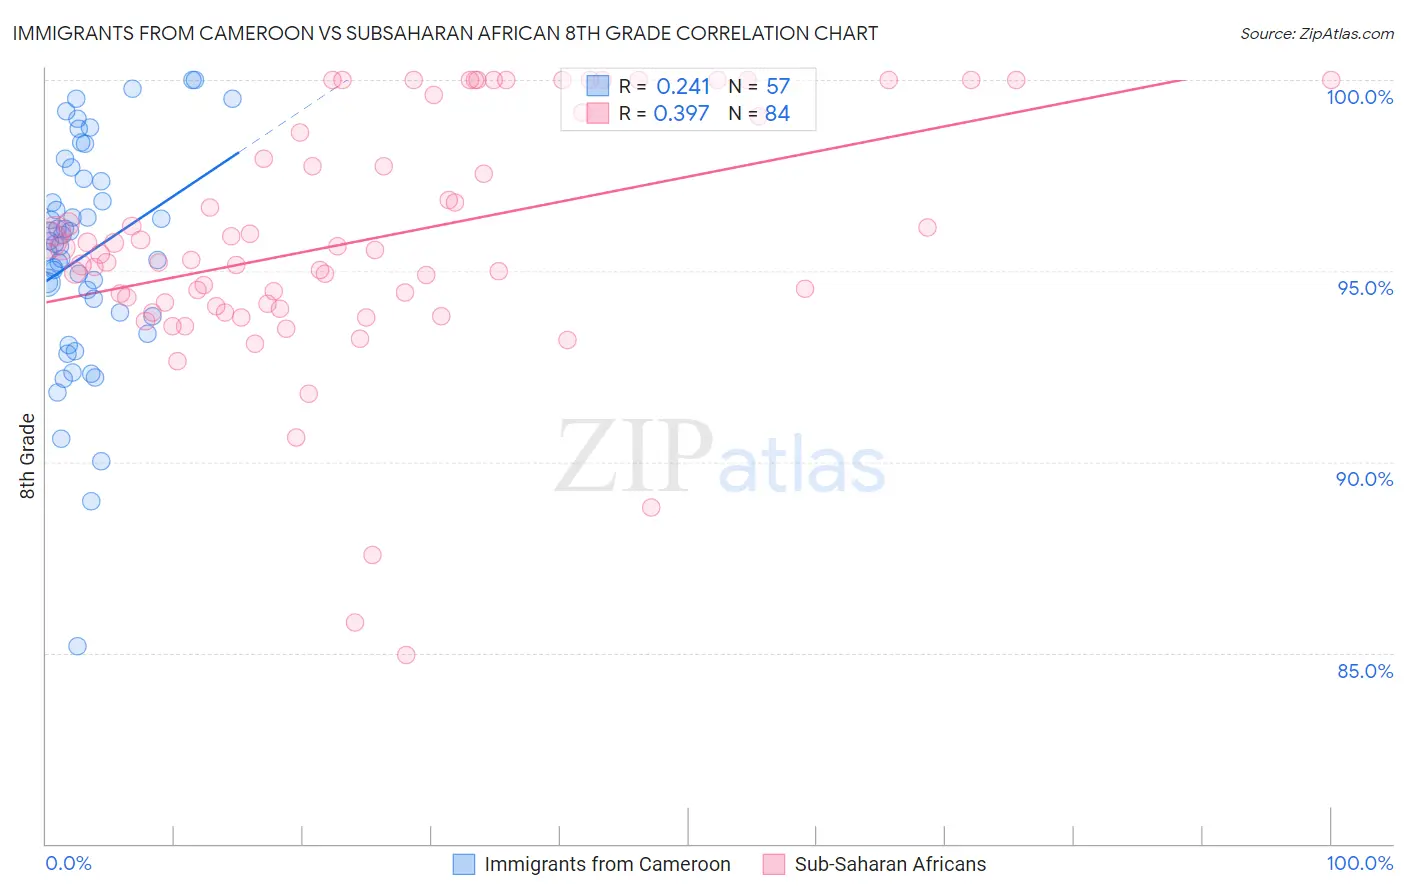
Immigrants from Cameroon vs Subsaharan African 8th Grade Correlation Chart
The statistical analysis conducted on geographies consisting of 130,618,704 people shows a weak positive correlation between the proportion of Immigrants from Cameroon and percentage of population with at least 8th grade education in the United States with a correlation coefficient (R) of 0.241 and weighted average of 95.0%. Similarly, the statistical analysis conducted on geographies consisting of 508,210,020 people shows a mild positive correlation between the proportion of Sub-Saharan Africans and percentage of population with at least 8th grade education in the United States with a correlation coefficient (R) of 0.397 and weighted average of 95.3%, a difference of 0.33%.
8th Grade Correlation Summary
| Measurement | Immigrants from Cameroon | Subsaharan African |
| Minimum | 85.2% | 84.9% |
| Maximum | 100.0% | 100.0% |
| Range | 14.8% | 15.1% |
| Mean | 95.4% | 95.8% |
| Median | 95.7% | 95.5% |
| Interquartile 25% (IQ1) | 93.9% | 94.1% |
| Interquartile 75% (IQ3) | 97.4% | 98.8% |
| Interquartile Range (IQR) | 3.5% | 4.7% |
| Standard Deviation (Sample) | 2.9% | 3.2% |
| Standard Deviation (Population) | 2.9% | 3.2% |
Similar Demographics by 8th Grade
Demographics Similar to Immigrants from Cameroon by 8th Grade
In terms of 8th grade, the demographic groups most similar to Immigrants from Cameroon are U.S. Virgin Islander (95.0%, a difference of 0.020%), Immigrants from Somalia (95.0%, a difference of 0.020%), Bolivian (95.0%, a difference of 0.030%), Immigrants from Ethiopia (95.0%, a difference of 0.030%), and Colombian (95.0%, a difference of 0.030%).
| Demographics | Rating | Rank | 8th Grade |
| Immigrants | Senegal | 1.4 /100 | #247 | Tragic 95.1% |
| Uruguayans | 1.2 /100 | #248 | Tragic 95.1% |
| Immigrants | China | 1.1 /100 | #249 | Tragic 95.0% |
| Koreans | 1.1 /100 | #250 | Tragic 95.0% |
| Bolivians | 1.0 /100 | #251 | Tragic 95.0% |
| Immigrants | Ethiopia | 1.0 /100 | #252 | Tragic 95.0% |
| U.S. Virgin Islanders | 0.9 /100 | #253 | Tragic 95.0% |
| Immigrants | Cameroon | 0.8 /100 | #254 | Tragic 95.0% |
| Immigrants | Somalia | 0.7 /100 | #255 | Tragic 95.0% |
| Colombians | 0.7 /100 | #256 | Tragic 95.0% |
| Afghans | 0.6 /100 | #257 | Tragic 94.9% |
| Immigrants | Congo | 0.6 /100 | #258 | Tragic 94.9% |
| Ghanaians | 0.6 /100 | #259 | Tragic 94.9% |
| Immigrants | Jamaica | 0.6 /100 | #260 | Tragic 94.9% |
| Immigrants | Costa Rica | 0.5 /100 | #261 | Tragic 94.9% |
Demographics Similar to Sub-Saharan Africans by 8th Grade
In terms of 8th grade, the demographic groups most similar to Sub-Saharan Africans are Immigrants from Western Asia (95.3%, a difference of 0.0%), Navajo (95.3%, a difference of 0.010%), Bahamian (95.3%, a difference of 0.010%), Immigrants from Eastern Africa (95.3%, a difference of 0.010%), and Immigrants from Malaysia (95.3%, a difference of 0.030%).
| Demographics | Rating | Rank | 8th Grade |
| Dutch West Indians | 8.1 /100 | #218 | Tragic 95.4% |
| Spanish Americans | 8.0 /100 | #219 | Tragic 95.4% |
| Immigrants | Southern Europe | 7.7 /100 | #220 | Tragic 95.3% |
| Immigrants | Syria | 7.4 /100 | #221 | Tragic 95.3% |
| Immigrants | Malaysia | 7.3 /100 | #222 | Tragic 95.3% |
| Immigrants | Oceania | 7.1 /100 | #223 | Tragic 95.3% |
| Immigrants | Western Asia | 6.0 /100 | #224 | Tragic 95.3% |
| Sub-Saharan Africans | 6.0 /100 | #225 | Tragic 95.3% |
| Navajo | 5.7 /100 | #226 | Tragic 95.3% |
| Bahamians | 5.6 /100 | #227 | Tragic 95.3% |
| Immigrants | Eastern Africa | 5.6 /100 | #228 | Tragic 95.3% |
| Immigrants | Indonesia | 4.4 /100 | #229 | Tragic 95.3% |
| Immigrants | Panama | 4.1 /100 | #230 | Tragic 95.2% |
| Asians | 3.5 /100 | #231 | Tragic 95.2% |
| Indians (Asian) | 3.3 /100 | #232 | Tragic 95.2% |