Immigrants from Cameroon vs Cambodian Single Male Poverty
COMPARE
Immigrants from Cameroon
Cambodian
Single Male Poverty
Single Male Poverty Comparison
Immigrants from Cameroon
Cambodians
11.5%
SINGLE MALE POVERTY
99.9/ 100
METRIC RATING
44th/ 347
METRIC RANK
11.8%
SINGLE MALE POVERTY
99.8/ 100
METRIC RATING
61st/ 347
METRIC RANK
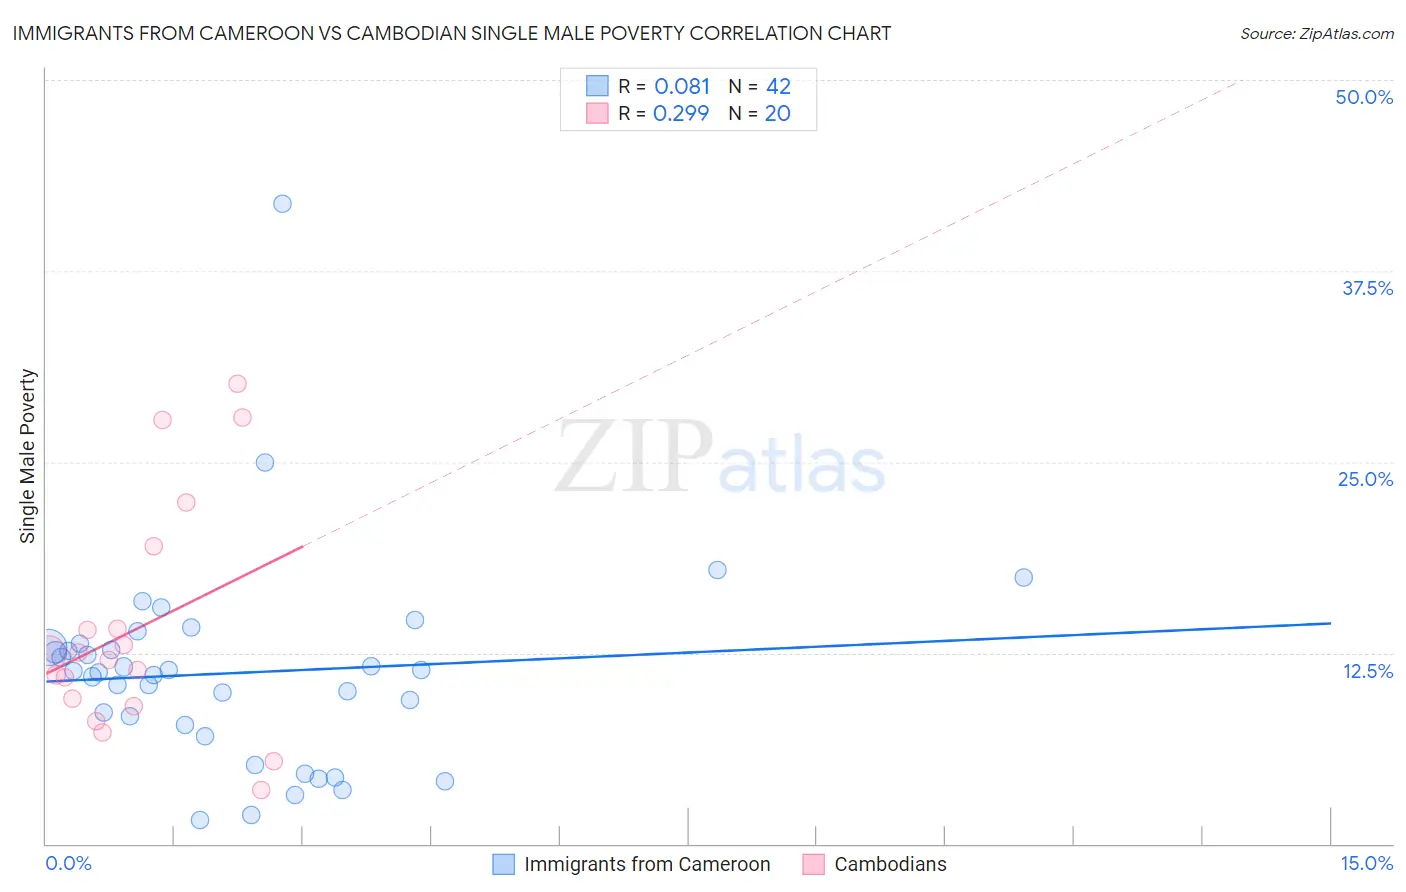
Immigrants from Cameroon vs Cambodian Single Male Poverty Correlation Chart
The statistical analysis conducted on geographies consisting of 124,431,702 people shows a slight positive correlation between the proportion of Immigrants from Cameroon and poverty level among single males in the United States with a correlation coefficient (R) of 0.081 and weighted average of 11.5%. Similarly, the statistical analysis conducted on geographies consisting of 97,412,896 people shows a weak positive correlation between the proportion of Cambodians and poverty level among single males in the United States with a correlation coefficient (R) of 0.299 and weighted average of 11.8%, a difference of 2.0%.
Single Male Poverty Correlation Summary
| Measurement | Immigrants from Cameroon | Cambodian |
| Minimum | 1.5% | 3.5% |
| Maximum | 41.9% | 30.1% |
| Range | 40.4% | 26.6% |
| Mean | 11.2% | 14.1% |
| Median | 11.3% | 12.2% |
| Interquartile 25% (IQ1) | 7.8% | 9.2% |
| Interquartile 75% (IQ3) | 12.8% | 16.8% |
| Interquartile Range (IQR) | 5.0% | 7.5% |
| Standard Deviation (Sample) | 6.8% | 7.6% |
| Standard Deviation (Population) | 6.7% | 7.4% |
Demographics Similar to Immigrants from Cameroon and Cambodians by Single Male Poverty
In terms of single male poverty, the demographic groups most similar to Immigrants from Cameroon are Immigrants from Peru (11.5%, a difference of 0.010%), Immigrants from Poland (11.5%, a difference of 0.020%), Immigrants from Bulgaria (11.6%, a difference of 0.15%), Egyptian (11.5%, a difference of 0.17%), and Nepalese (11.6%, a difference of 0.34%). Similarly, the demographic groups most similar to Cambodians are Peruvian (11.8%, a difference of 0.020%), Brazilian (11.8%, a difference of 0.23%), Immigrants from Brazil (11.7%, a difference of 0.32%), Immigrants from Romania (11.7%, a difference of 0.34%), and Immigrants from Sri Lanka (11.8%, a difference of 0.38%).
| Demographics | Rating | Rank | Single Male Poverty |
| Egyptians | 99.9 /100 | #42 | Exceptional 11.5% |
| Immigrants | Peru | 99.9 /100 | #43 | Exceptional 11.5% |
| Immigrants | Cameroon | 99.9 /100 | #44 | Exceptional 11.5% |
| Immigrants | Poland | 99.9 /100 | #45 | Exceptional 11.5% |
| Immigrants | Bulgaria | 99.9 /100 | #46 | Exceptional 11.6% |
| Nepalese | 99.9 /100 | #47 | Exceptional 11.6% |
| Immigrants | Indonesia | 99.9 /100 | #48 | Exceptional 11.6% |
| Tlingit-Haida | 99.9 /100 | #49 | Exceptional 11.6% |
| Immigrants | Lithuania | 99.9 /100 | #50 | Exceptional 11.6% |
| Paraguayans | 99.9 /100 | #51 | Exceptional 11.6% |
| Samoans | 99.9 /100 | #52 | Exceptional 11.7% |
| Bulgarians | 99.9 /100 | #53 | Exceptional 11.7% |
| Immigrants | Uzbekistan | 99.9 /100 | #54 | Exceptional 11.7% |
| Cypriots | 99.9 /100 | #55 | Exceptional 11.7% |
| Burmese | 99.8 /100 | #56 | Exceptional 11.7% |
| Immigrants | Romania | 99.8 /100 | #57 | Exceptional 11.7% |
| Immigrants | Brazil | 99.8 /100 | #58 | Exceptional 11.7% |
| Brazilians | 99.8 /100 | #59 | Exceptional 11.8% |
| Peruvians | 99.8 /100 | #60 | Exceptional 11.8% |
| Cambodians | 99.8 /100 | #61 | Exceptional 11.8% |
| Immigrants | Sri Lanka | 99.7 /100 | #62 | Exceptional 11.8% |